
1. Prep Work:
Before running the tool, it is important to:
- Identify the goals of the planning effort
- Gather available data and determine what layers to use
- Determine weight of each data layer
- Identify local expertise required for interpreting the Tool output
- Identify the Tool modules to be included in the analysis
2. Regional Base Analysis
If The Regional Base Analysis is checked in the user interface, then a layer that identifies the most suitable locations for each LID type will intersect with all other layer, excluding possible locations outside of that area. The Base Analysis LID layers identify the most suitable areas using categorical weighted overlay of depth to groundwater, land use, liquefaction risk, hydrologic soil type, and percent slope.
3. Locations Analysis
The Location analysis takes layers identified as possible locations for LID and assigns them for suitable LID types. For example it may identify side street parking as possible locations for bioretention but not for a wet pond. Other possible locations include road medians, sidewalk planters, parks, open spaces, vacant lots etc. These possible location layers also indicate if they are by nature public or privately owned locations.
4. Local Opportunities and Constraints Analysis
The Local Opportunities and Constraints Analysis unions potential locations identified with a ranking layer that is developed based on the Opportunities and Constraints table which weights and ranks different layers within weighted priorities and factors, such as Water Quality, Development Plans, Installation Feasibility and Community Visibility. These factors are completely customizable and one can add or remove them based on their local priorities and information availability.
5. Ownership Analysis
The Ownership Analysis applies a public or private ownership value to each possible location. This allows for separate public and private outputs to be generated from the LID Site Locator Tool.
6. Knockout Analysis
The Knockout Analysis removes areas where LID is not a possible location by erasing them from the output. Possible knockout layers include wetlands, other natural habitats or water features, and building foot prints.
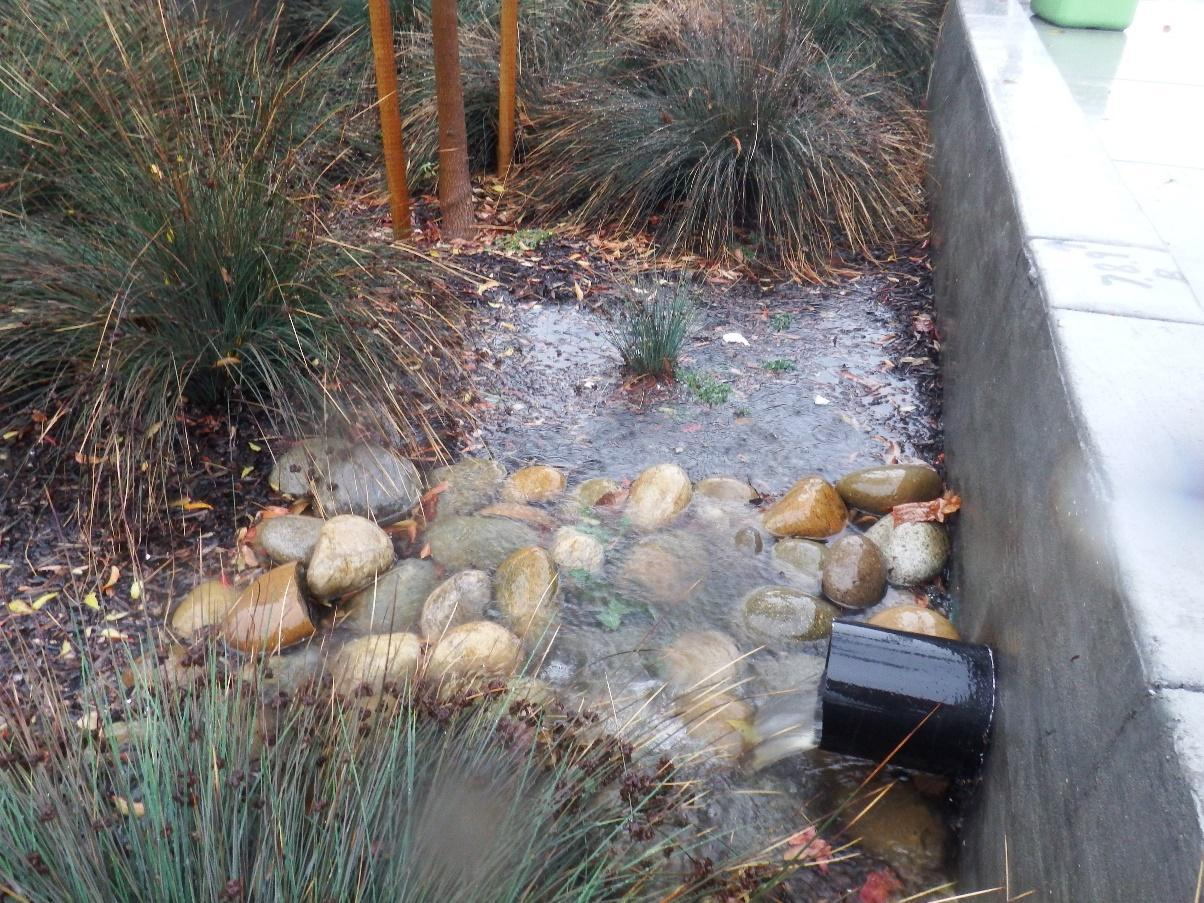
7. Site Visit
The Outputs should then be reviewed by either visiting locations or remotely checking (ex. View in google earth) locations that are ranked as highly ranked locations as well as low ranked locations in order to ensure that the tool is ranking possible LID locations appropriately.
8. Model Refinement
Based on review of the LID Site Locator Tool’s outputs, either via remote sensing or by site visits the user may choose to adjust their weighting or ranking or even refine their possible location layers in order to create a more refined output for the LID Site Locator Tool.
9. Iteration
Through Iteration and refinement of parameters in the data tables one can refine the outputs to create a useful planning level map to help identify and prioritize different possible locations for Low Impact Development.
