GreenPlan-IT Toolkit Demonstration Report
GreenPlan-IT Toolkit Demonstration Report
Prepared by
SAN FRANCISCO ESTUARY INSTITUTE
4911 Central Avenue, Richmond, CA 94804
Phone: 510-746-7334 (SFEI)
Fax: 510-746-7300
www.sfei.org
Table of Contents
1.1. Project Rationale
1.2. Overview of GreenPlan-IT Toolkit
1.3. GreenPlan-IT Toolkit Application Process
Chapter 2. Case Study: City of San Mateo
2.1 Project setting
2.2 Data layers collected and used for locator tool
2.3 Site Locator tool setup
2.4 Results Analysis
Chapter 3. Case Study: San Jose Priority Development Area
3.1 Project Setting
3.2 GIS Site Locator Tool
- Data layers collected and used
- Site Locator tool setup
- Results Analysis
- Ranking of sites
- Expected/desired final product
- Final steps to get all results to 100% (maps)
3.3 Modeling Tool
3.3.1 Data Collection
3.3.2 Model Setup
3.3.3 Model Calibration
3.3.4 Baseline Condition
3.4 Optimization Tool
3.4.1 Focus Area
3.4.2 Optimization Problem Formulation
3.4.3 Design Storm
3.4.4 GI Representation
3.4.5 GI Cost
3.4.6 Optimization Results
3.4.7 Sensitivity Analysis
Chapter 4. Discussion and Recommendations
4.1 Lessons learned
4.2 Data Gaps
4.3 Future steps/enhancement
Executive Summary
GreenPlan-IT is a planning level tool that was developed by SFEP and SFEI with support and oversight from BASMAA to provide Bay Area municipalities with the ability to evaluate multiple management alternatives using green infrastructure for addressing stormwater issues in urban watersheds. GreenPlan-IT combines sound science and engineering principles with GIS analysis and optimization techniques to support the cost-effective selection and placement of Green Infrastructure (GI) at a watershed scale. Tool outputs can be used to develop quantitatively-derived watershed master plans to guide future GI implementation for improving water quality in the San Francisco Bay and its tributary watersheds.
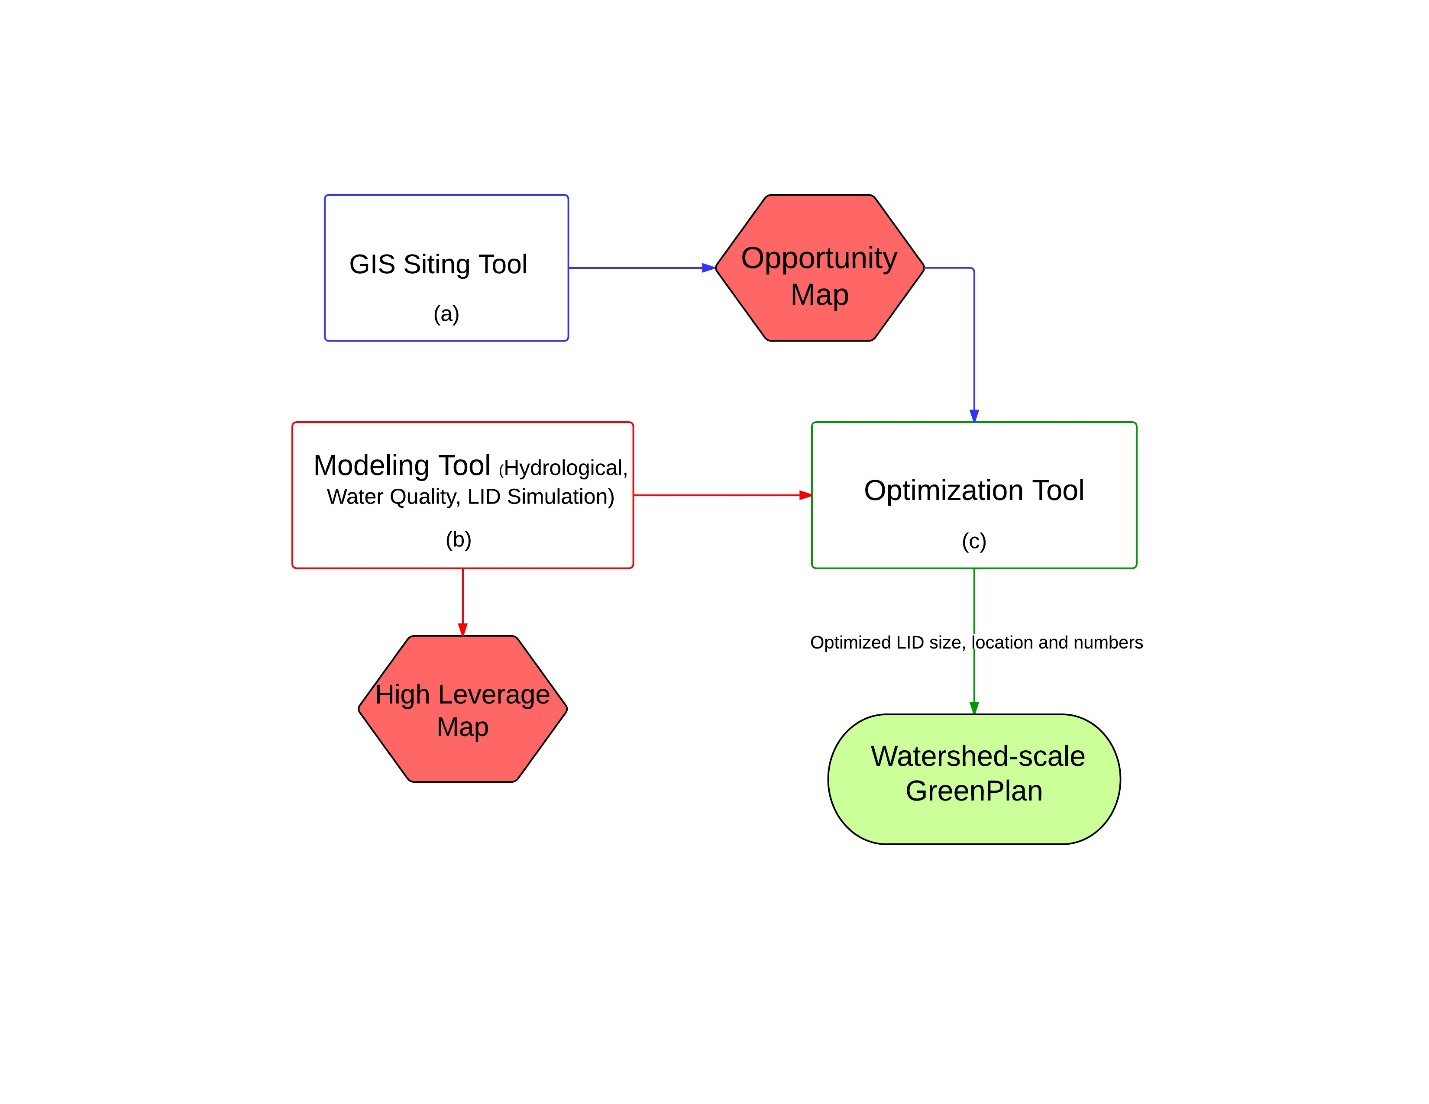
Structurally, the GreenPlan-IT is comprised of three components: (a) a GIS-based Site Locator Tool to identify potential GI sites; (b) a Modeling Tool that quantifies anticipated watershed-scale runoff and pollutant load reduction from GI sites; and (c) an Optimization Tool that uses a cost-benefit analysis to identify the best combinations of GI types and number of sites within a watershed for achieving flow and/or load reduction goals. The three tool components were designed as standalone modules to provide flexibility and their interaction is either through data exchange, or serving as a subroutine to another tool.
This report provides an overview of the GreenPlan-IT Tool and demonstrates its utility and power through two pilot studies which is summarized in this report as a case study. The pilot studies with the City of San Mateo and the City of San Jose explored the use of GreenPlan-IT for identifying feasible and optimal GI locations for mitigation of stormwater runoff. They are provided here to give the reader an overview of the user application process from start to finish, including problem formulation, data collection, GIS analysis, establishing a baseline condition, GI representation, and the optimization process. Through the pilot study application process the general steps and recommendations for how GreenPlan-IT can be applied and interpreted are presented.
The pilot with the City of San Mateo utilized only the GIS Site Locator Tool to screen potential sites for GI implementation in five discrete watersheds (Borel Creek, Laurel Creek, Leslie Creek, Poplar Creek, San Mateo Creek) as well as multiple unnamed drainages. Using selected regional and local data layers and the City’s ranking and weighting and using all five optional analyses, the Site Locator Tool identified 18 acres of City-owned property or right-of-way as highly ranked locations for potential GI implementation, 113 acres as moderately ranked, and 11 acres as lower ranked locations. A remote data vaGIation exercise confirmed that many of the sites identified and ranked highly by the locator tool were also sites previously identified as potential GI opportunities by the city of San Mateo.
The pilot study with City of San Jose used the full Toolkit to support a cost-benefit evaluation of stormwater runoff control. The objective of this pilot was to demonstrate the capacities and usability of GreenPlan-IT for identifying feasible and cost-effective GI locations at a watershed scale. The focus area was a 4300 acre proposed development area within the lower part of the Guadalupe River Watershed. The Site Locator Tool identified possible GI locations that serve as the constraints for the optimization process; the Modeling Tool established a representative baseline condition through calibration to local data; and then the Optimization Tool was used to repeatedly run the Modeling Tool to iteratively arrive at the optimized GI scenario that minimized the total cost of management while satisfying water quality and quantity constraints. The results of the application included the cost/benefit associated with a range of flow or loads reduction targets, ranking of sites for specific optimal solutions, and maps showing the distribution of GI within the study area under a specific optimal solution.
The Site Locator Tool has end-user flexibility that results in an iterative tool that can be fine-tuned as questions and goals change or more accurate local data are available. Establishing a representative baseline model is crucial for meaningful results and requires the calibration of the Modeling Tool to local data. The Optimization Tool can be very powerful when combined with hydrologic modeling and cost analyses. Successful and meaningful application of the Optimization Tool largely depends on accurate representation of the watershed baseline condition, GI configurations, and the associated GI costs. The cost-effective solutions from the optimization process must be interpreted in the context of specific problem formulation, assumptions, constraints, and optimization goals unique to each application. With the help of this information, decision makers can set realistic goals on how much can be achieved and the level of investment required, as well as determine at what point further investment on GI will yield no improvement in runoff reduction.
Introduction
Chapter 1
Water quality in the San Francisco Bay and its watersheds is impaired by PCBs, mercury, pesticides and a number of other pollutants associated with stormwater runoff. Reducing stormwater runoff and contaminant loads is complex and relies on costly engineering, especially in highly-developed urban environments. Increasingly, distributed management of stormwater runoff using Green infrastructure (GI) is emerging as a multi-benefit solution that can address both stormwater quality and quantity concerns. Consistent with this trend, and under anticipated new stormwater permit provisions due in 2015, Bay Area local governments will be required to develop and implement watershed-scale green infrastructure plans to achieve quantitative water quality improvements.
A major barrier to regional-scale, widespread implementation of GI is a lack of watershed-based planning regarding where opportunity sites exist for GI retrofits and what constitutes the most cost-effective, achievable, and practical management strategy for achieving water quality targets for local landscapes. Realizing the need for a planning tool to support Bay Area municipalities to strategically plan and implement GI projects at a watershed scale, the State Board funded a research project[1] to develop a Toolkit that meets technical and institutional requirements for successful selection and implementation of GI projects. The resulting Toolkit was branded “GreenPlan-IT”. The Toolkit package, consisting of the software, companion user manuals, and this demonstration report, is available on the GreenPlan-IT Web site hosted by SFEI (http://greenplanit.sfei.org/).
This report describes the rationale for developing the GreenPlan-IT Toolkit; explains the Toolkit’s design and structure; and demonstrates the Toolkit’s capabilities through two case studies. Where appropriate, this report also examines the limitations of the Toolkit and provides recommendations for future enhancements. The additional input data/outputs for the Toolkit are also included in the appendices.
1.1 Project Rationale
Surface water degradation resulting from stormwater runoff has been an issue of primary focus for many Bay Area agencies. Despite the recognized effectiveness of GI in protecting water quality and reducing flood risk, and the mandatory implementation of GI under limited circumstances under the current NPDES Stormwater Municipal Regional Permit (MRP), the Bay Area’s implementation of GI continues slowly. To date, GI projects are largely placed opportunistically (e.g., where land becomes available), or as demonstration projects, at different points throughout a drainage area, with unknown and likely suboptimal flow and load reduction effectiveness. Little is known about the cumulative effects of implementing hundreds or even thousands of GI projects in Bay Area watersheds, either alone or in well-planned combination with “grey infrastructure” approaches. In addition, future MRPs will likely require local agencies to implement GI to achieve set goals at the watershed scale. Bay Area agencies need a scientifically sound planning tool to help develop quantitatively-derived watershed master plans to guide future GI implementation for improving water quality in the San Francisco Bay and its tributary watersheds.
GreenPlan-IT was developed to meet this critical need. The Toolkit can facilitate identification, evaluation and ranking of potential sites based on their relative feasibility and potential effectiveness in reducing stormwater runoff and pollutant loads. GreenPlan-IT can help Bay Area municipalities to address the following key stormwater management questions:
- Where are the suitable locations for GI implementation within the built-out urban environment?
- Where are the effective locations for GI implementation that could have the greatest potential leverage or effectiveness for reducing peak flow runoff and contaminant loads?
- What quantitative water quality and hydrological improvements can be made with GI approaches?
- What are the most cost-effective GI combinations for achieving certain reduction targets?
GreenPlan-IT combines a GIS screening tool, a publically available modeling platform, and an Optimization Tool to provide users with the ability to evaluate multiple stormwater management alternatives to support their decision making for addressing a variety of issues. The Toolkit can be used to comply with NPDES stormwater permit requirements including the development of an alternative compliance program, as well as addressing loads reduction needs identified in TMDLs. The Toolkit is intended for knowledgeable users familiar with GI and the technical aspects of watershed modeling, and applicable to predominantly urban watersheds. Although designed as a tool for Bay Area stormwater agencies, the tool has broad applicability and could be used by other regions as well.
1.2 Overview of GreenPlan-IT Toolkit
The GreenPlan-IT Toolkit is designed to support the cost-effective selection and placement of GI in urban watersheds through GIS analysis, hydrologic modeling and optimization techniques. The Toolkit consists of three components: GIS Site Locator Tool, Modeling Tool, and Optimization Tool. To provide flexibility for the user community and for future updates, the three components were designed as standalone modules and their interaction is either through data exchange, or as a submodule linked to another tool component. Figure 1-1 shows a generalized schematic of the Toolkit. Each tool in the Toolkit performs specific functions and is typically applied in sequence.
Figure 1-1. Schematic of GreenPlan-IT Toolkit
GIS Site Locator Tool
The GIS based Site Locator Tool is a screening tool that can be used to identify and rank potential GI locations through GIS analysis. The Tool incorporates many regional, publicly available data layers and builds in five intersecting analyses that require user input data to produce maps of possible GI locations. These analyses are optional, providing end-user flexibility to add local data layers to best identify suitable locations and rankings of GI locations, to produce outputs of different levels of refinement, and to run the analyses with varying levels of data availability. The Site Locator Tool can be fine-tuned iteratively as additional local data or data with better resolution become available.
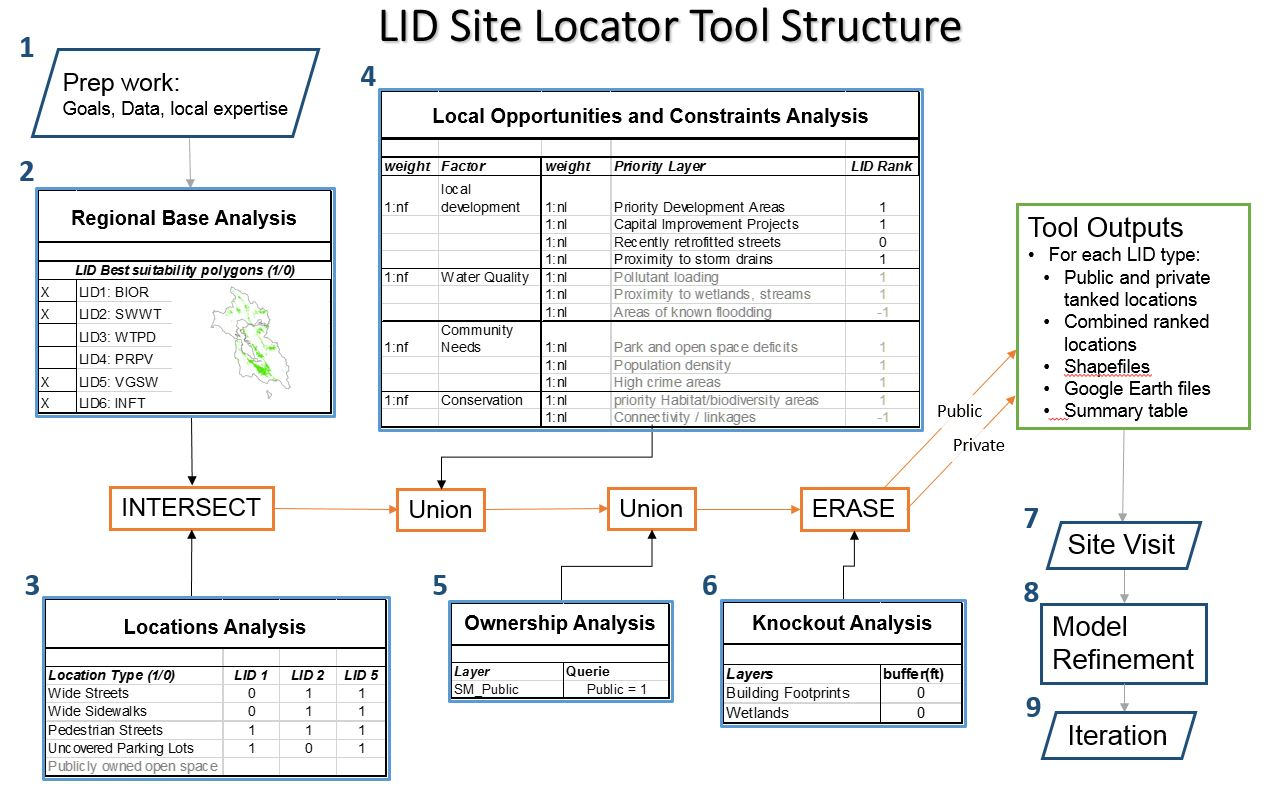
There are five optional analyses within the Site Locator Tool: the Regional Base Analysis (RBA), Locations Analysis, Opportunities and Constraints Analysis, Ownership Analysis, and Knockout Analysis (Figure 1-2). The Tool can be run with any combination or all analyses provided that data are included in each of the analysis tables. Also, there are six GI feature types in the Tool: bioretention, permeable pavement, vegetated swale, stormwater wetlands, wet pond, and infiltration trench. Any combination or all feature types can be selected when running the Tool.
The Regional Base Analysis is hardcoded and can’t be modified in the Tool. However, including the Regional Base Analysis in the Tool run is optional. This analysis provides a first estimate of GI possible locations based on regional data sets including depth to groundwater, hydrologic soil type, land use, liquefaction risk, and slope. In the analysis, each regional data set is weighted to reflect relative importance for GI suitability and is binned into relevant value bins which are ranked according to suitability for each GI type. These weights and rank values are then used in a Categorical Weighted Overlay to produce maps of the most suitable areas for each GI type. Since the data are regional in nature, the map outputs are grosser in scale and may remove potential GI locations from the output. Users can experiment by running the Tool with and without the Regional Base Analysis and then compare map outputs or use the RBA in the Opportunities and Constraints Analysis in a later step.
The Locations Analysis uses regional and local data layers to identify locations for GI implementation for each GI feature type selected. Specified location layers that are identified as potential locations are unioned in order to create a single layer for each GI type that represents all potential locations for that GI type. On-street parking, sidewalks, pedestrian trails, parking lots, and parks are example locations for implementing GI. Other potentially good locations could include traffic medians, brown field lots, and undeveloped land.
The Opportunities and Constraints Analysis is an editable table where both regional and local data sets can be added. Each data set is ranked as an opportunity (rank of 1) or a constraint (rank of -1) for GI implementation. Each data layer is then categorized into factors and then individually weighted within its factor. A weight is then assigned to each factor. These values were then used to calculate a final relative rank for each location.
The Ownership Analysis allows the Tool to delineate outputs into public and private possible location. This is only possible if a local ownership data layer exists. The ownership analysis can be important for identification of potential public private partnerships. It can also provide an opportunity to grossly analyze the proportional opportunity between publicly and privately own lands.
The Knockout Analysis in the Tool excludes landscape features that should not be included for GI consideration such as wetlands, riparian areas, and tidal areas. Buffer areas can be added to these features as well.
Once GI feature types have been selected and all input tables are filled out and the analyses are selected the Tool runs through each analysis sequentially. The Regional Base Analysis takes the area of interest and excludes all regional areas that were determined not suitable for each GI type. Next, the Locations Analysis intersects the Base Analysis area with all possible GI locations that were specified for each GI type selected. This refines the output to include only locations that are possible, as determined by the Regional Base Analysis, and meet the requirements identified in the Locations Analysis. The Opportunities and Constraints Analysis then applies a relative rank for each location by preforming a nested weighted sum. The Ownership Analysis then applies specified ownership data in order to label each location as either public or private. Lastly the Knockout Analysis removes any areas that are deemed infeasible from the map output.
The Tool produces a KML (Google Earth) and Arc-GIS map with color-coded relative rank of potential GI locations. The developed maps should then be validated via an on screen or field effort to provide verification of the ability for the input data and data ranking to produce real world results. Once validated, these sites, combined with local expert unmapped information such as areas of flooding or high pollutant areas, can serve as a starting point to plan and prioritize placement of GI within a watershed. The identified sites can also be used by the Optimization Tool to construct and constrain all potential locations in order to identify most cost-effective combinations for achieving specific management targets.
Figure 1-2. Structure of the GIS Site Locator Tool including pre-tool preparation and post tool steps.
Modeling Tool
The second tool component of the GreenPlan-IT Toolkit is built on a spatially distributed hydrologic and water quality model, EPA Storm Water Management Model (SWMM) version 5.0 (Rossman, 2010), to simulate the generation, fate and transport of stormwater runoff and associated pollutants from the landscape, as well as resulting flow and pollutant loading reduction as they pass through various GIs. The Modeling Tool is used to establish baseline conditions, identify high-yield runoff and pollution areas; and quantify any reduction made from GI implementation across different areas within a watershed. Within the Toolkit, the Modeling Tool serves as a subroutine to the Optimization Tool. At each iteration during the optimization process, the Optimization Tool will commend the Modeling tool to evaluate GI performance and pass that information back. This process progresses step by step marching towards the most cost-effective GI solutions.
Optimization tool
The third tool is an Optimization Tool which uses an evolutionary optimization technique (Non-dominated Sorting Genetic Algorithm II , Deb, et al 2002) to evaluate the benefits (runoff and pollutant load reductions) and costs associated with various GI implementation scenarios (type, location, number) and identify the most cost-effective options that satisfy user-defined management goals. The Optimization Tool requires the site information generated from the GIS Site Locator tool to form its search space, and uses the Modeling Tool as a subroutine during the search process in an iterative and evolutionary fashion to evaluate the GI performance. Therefore, using the Optimization Tool will require the running of both the Site Locator Tool and Modeling Tool.
1.3 GreenPlan-IT Toolkit Application Process
The application of the GreenPlan-IT Toolkit usually begins with the GIS Site Locator Tool, followed by the Modeling Tool, and concludes with the Optimization Tool. Since the Toolkit is constructed in a modular structure with three standalone tools, users can sometime choose to use just the GIS Site Locator Tool to do a preliminary screening on potential GI sites instead of using the full package. However, within the premise of this project, wherever possible, the application of the whole Toolkit is recommended, since optimal placement (achieving the most flow or load reduction) for the least cost is usually in the best interests of the public.
The typical step-by-step process in Toolkit application is as follows: 1) definition of study objectives; 2) data collection; 3) Toolkit setup, and 4) analysis of results. Figure1-3 is a flow diagram illustrating the Toolkit application process. The first step in the setup and application of the Toolkit is a clear definition of the study goals to ensure the most appropriate and useful application. An example of a study objective might be to identify a set of management options that achieve a required level of runoff. The study goals will define the scope and extent of the Toolkit application, including model domain, data needs, runoff and pollutant factors to be simulated, and the optimization evaluation factors and flow or pollutant load reduction targets.
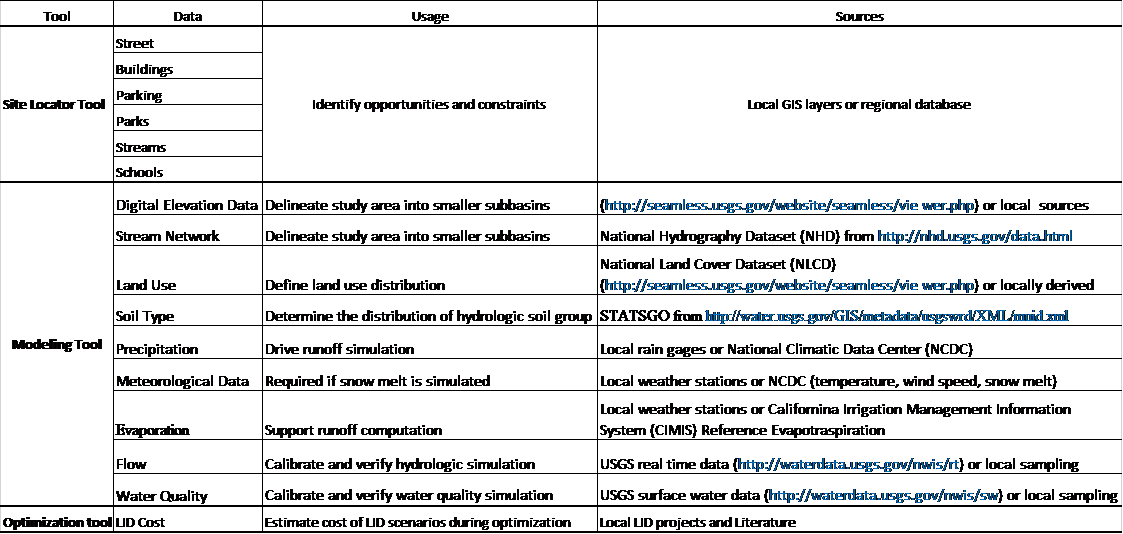
The data collection for the Toolkit application involves a thorough review and compilation of data available for the study area. The Toolkit requires a variety of input data including GIS data, landscape characteristics data, GI data, and monitoring data. Table 1-1 shows a summary of typical data needs for each tool. Because the quality of the Toolkit outputs depends on the quality of input data, locally derived higher-resolution data are desired, wherever possible.
Setting up the Toolkit involves using the data collected to establish a representation of the study area. Since there is no linkage between the Site Locator Tool and Modeling Tool, they can be set up in parallel. In the case of the Modeling Tool, model calibration with local data is needed in order to ensure the establishment of a representative baseline condition. The Optimization Tool then synthesizes information from the Site Locator Tool and Modeling Tool and generates solutions that are looped back to the Modeling Tool for an iterative evaluation. Via this evolutionary search process, the most cost-effective GI solutions are identified according to the user’s specific conditions and objectives. The results of the application include the cost/benefit associated with a range of flow or loads reduction targets, ranking of sites for specific optimal solutions, and maps showing the distribution of GI within the study area under a specific optimal solution.

Figure 1-3. GreenPlan-IT Toolkit application process.
Table 1-1 Summary of typical data needs for the Toolkit
[1] Initiated by San Francisco Estuary Partnership (SFEP), San Francisco Estuary Institute (SFEI), Bay Area Storm Water Management Agencies Association (BASMAA), and partnering municipalities in 2013 through the Proposition 84 Storm Water Grant Program.
Case Study: City of San Mateo
Chapter 2
2.1 City of San Mateo’s Sustainable Street Effort
The City of San Mateo was one of two primary municipal partners in the development of the GIS Site Locator Tool. San Mateo is a city on the San Francisco Peninsula with a population of about 100,000 people. When the Green Plan Bay Area project began, the City was in the process of developing a Sustainable Streets Plan. This plan combined two other city planning efforts, a Complete Streets Plan and a Green Streets Plan, into one comprehensive plan. The Complete Streets Plan balances development and redevelopment of all modes of transportation including pedestrian, bicycle, cars, and public transportation in order to create streetscapes accessible to all transportation modes. The Green Streets Plan creates a blueprint for urban greening and returning some more natural watershed function and attributes to the cityscape. One of the primary benefits for urban greening and implementing green infrastructure is to improve the water quality of stormwater runoff that drains to the Bay. In addition, the City also desired other green infrastructure benefits such as beautification, increased areas of urban habitat, and traffic calming that can help reduce the cost to benefit ratio associated with green infrastructure implementation. Together, these plans create a re-visioning of urban streets for planning and integrating transportation modes with urban greening.
2.2 Case Study Objectives
The Project Team (staff from the City of San Mateo and City of San Jose, other municipalities, BASMAA, and technical advisors) held three meetings to identify Toolkit needs and useful functionality that would be most essential for city planning efforts. Site Locator Tool recommendations from the TAC included adding public/private ownership delineations on map outputs, enabling the Regional Base Analysis an optional part of the Tool, and identifications of useful data layers for running the Tool. Once the beta version of the Site Locator Tool was developed, the development team worked with the City of San Mateo to start the pilot effort.
One of the primary goals for San Mateo was to identify potential GI locations for inclusion in the Sustainable Streets Plan (Figure 2-1). Since this plan was focused on redeveloping streetscapes, the most useful data pertained to street width, sidewalk width, existing sidewalk planters, and areas of damaged streets and sidewalks that could be considered for future repair. San Mateo plans to capitalize on combining Green Infrastructure with multiple modes of transportation so the City wanted to include existing and potential pedestrian paths (along with streets and sidewalks) as potential GI locations. The City was most interested in identifying locations for bioretention features so this feature type was selected and run through the various analyses. The City elected to include the Regional Base Analysis in the Tool run. This analysis removes locations for consideration that don’t meet the base criteria which can result in the exclusion of many locations that could be areas for GI but may need additional engineering.
Figure 2-1. Design guidelines for City of San Mateo street zones including planned zones for Green Infrastructure implementation (Courtesy of City of San Mateo).
2.2 Project setting
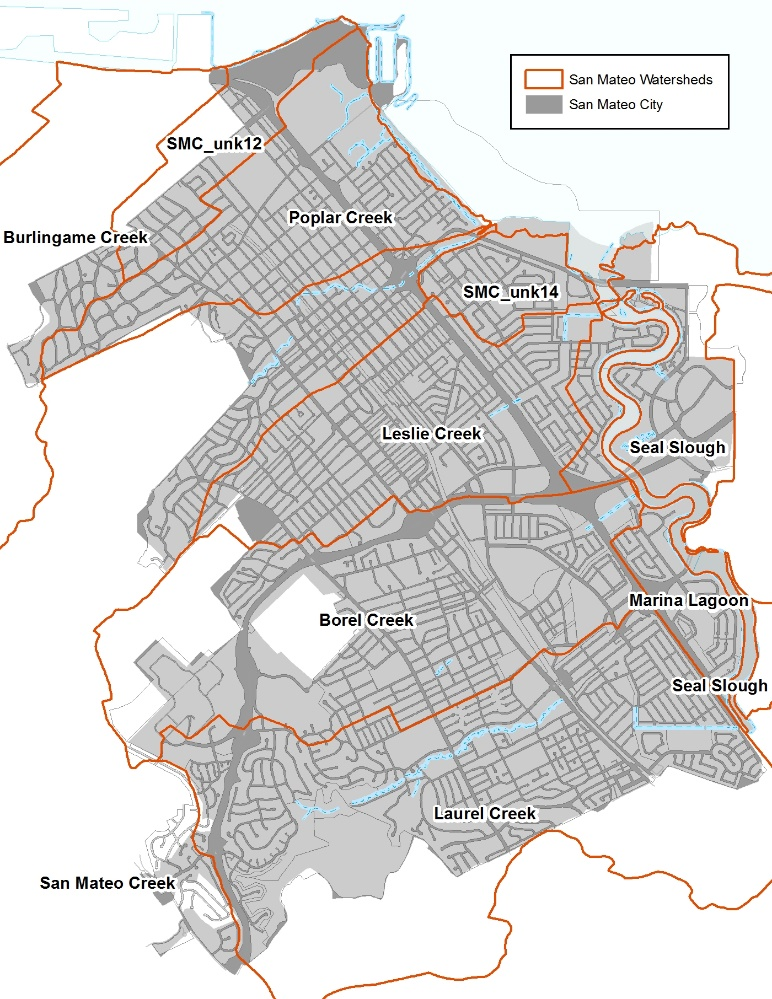
In San Mateo, the GIS Site Locator Tool was demonstrated in five discrete watersheds including Borel Creek, Laurel Creek, Leslie Creek, Poplar Creek, San Mateo Creek, as well as multiple unnamed drainages (Figure 2-2).
2.3 Site Locator Tool: Data layers used and decision process
The GIS Site Locator Tool integrates regional and local GIS data and uses these data, through an identification, ranking and weighting process, to locate potential GI locations at a watershed scale. Data accuracy is an important determinant in the accuracy of map outputs produced by the Tool. The quality, scale and accuracy of the input data will determine the quality, scale and accuracy of the output maps. Therefore, it is highly beneficial to use more accurate and local data when available. When using more regional scale data layers for analyses, such as the opportunities and constraints ranking analysis, the user can weight and rank these layers to reflect the confidence in local accuracy of the data. There are many regional GIS data that are included in the Tool (Table 2-1) and additional regional data sets can be added as well. Local data sets can be added to the Tool in order to help identify potential locations that meet the goals and planning needs of each city. Each municipality will identify a set of questions or goals to answer or meet prior to running the Tool. These questions or goals become the drivers for deciding which data sets to include.
Figure 2-2. Map showing City of San Mateo watersheds and drainage areas included in the demonstration project. Orange lines delineate each watershed boundary. Note that some watershed boundaries are outside the City.
Table 2-1. Regional GIS data layers included in the Site Locator Tool.
|
GIS Data Layer Name |
GIS Data Layer Description |
|
CPAD_2014a2_Holdings |
California Protected Areas database released in the first half of 2014 |
|
FEMA_NFHL |
National Flood Hazard Layers for all BA counties |
|
Employment_Investment_areas_SCS |
From ABAG's data webpage |
|
Priority Development Areas_Current |
From ABAG's data webpage. Priority Development Areas (Current) - This feature set contains changes made to Priority Development Areas since the adoption of Plan Bay Area. DO NOT USE this feature set for mapping or analysis related to Plan Bay Area. |
|
K_12_Schools |
Schools in the bay area (point data) |
|
NLCD2011_PercentImpervious |
Percent Impervious data from the 2011 National Land Cover Dataset |
|
OSM_Buildings |
Open Street Map layer for the Bay Area _Late2014 |
|
OSM_Libraries |
Open Street Map layer for the Bay Area _Late2014 |
|
OSM_Parking |
Open Street Map layer for the Bay Area _Late2014 |
|
OSM_Parks |
Open Street Map layer for the Bay Area _Late2014 |
|
OSM_Schools |
Open Street Map layer for the Bay Area _Late2014 |
|
OSM_Streets |
Open Street Map layer for the Bay Area _Late2014 |
|
R2_CARI_PublicV |
California Aquatic Resource Inventory for Region 2 |
|
Regional_Bike_Facilities_Bay |
Regional bike facilities for the Bay Area |
|
RWQC_RB_2 |
Region 2 Water Board Boundary |
For the city of San Mateo, the primary driver for implementing GI was the Sustainable Streets Plan. Since this plan focused on streetscape redevelopment, spatial data that quantified street and sidewalk attributes and integrated Complete Street concepts were important data for inclusion in the Tool. The City elected to run each of the Tool analyses including the Regional Base Analysis.
Primary locations identified by the City were public parks, pedestrian trails, wide streets, wide sidewalks, existing planters, and parking lots. The city also identified planning opportunities such as areas planned for redevelopment (PDAs), areas of damaged streets/sidewalks, Greenway Networks, and Regional Bike Facilities as well as constraints to GI implementation including sidewalks with large trees, fire lanes, and narrow streets. These opportunities and constraints were then categorized into factors such as funding opportunities, local development opportunities, community visibility, and installation feasibility. These factors were then weighted to produce a relative ranking of areas for potential GI implementation,
The City also included a data layer that identified City-owned parcels in the ownership analysis which allowed for a public/private delineation of locations in the map outputs. The last analysis removes areas that are not feasible GI locations such as wetlands, riparian areas, and areas with utility mains close to the surface. The City excluded all areas intersecting existing wetlands and the San Mateo Lagoon in this analysis. Table 2-2 shows the regional and local GIS data layers included in the Site Locator Tool for the City of San Mateo.
2.5 Site Locator Tool Results
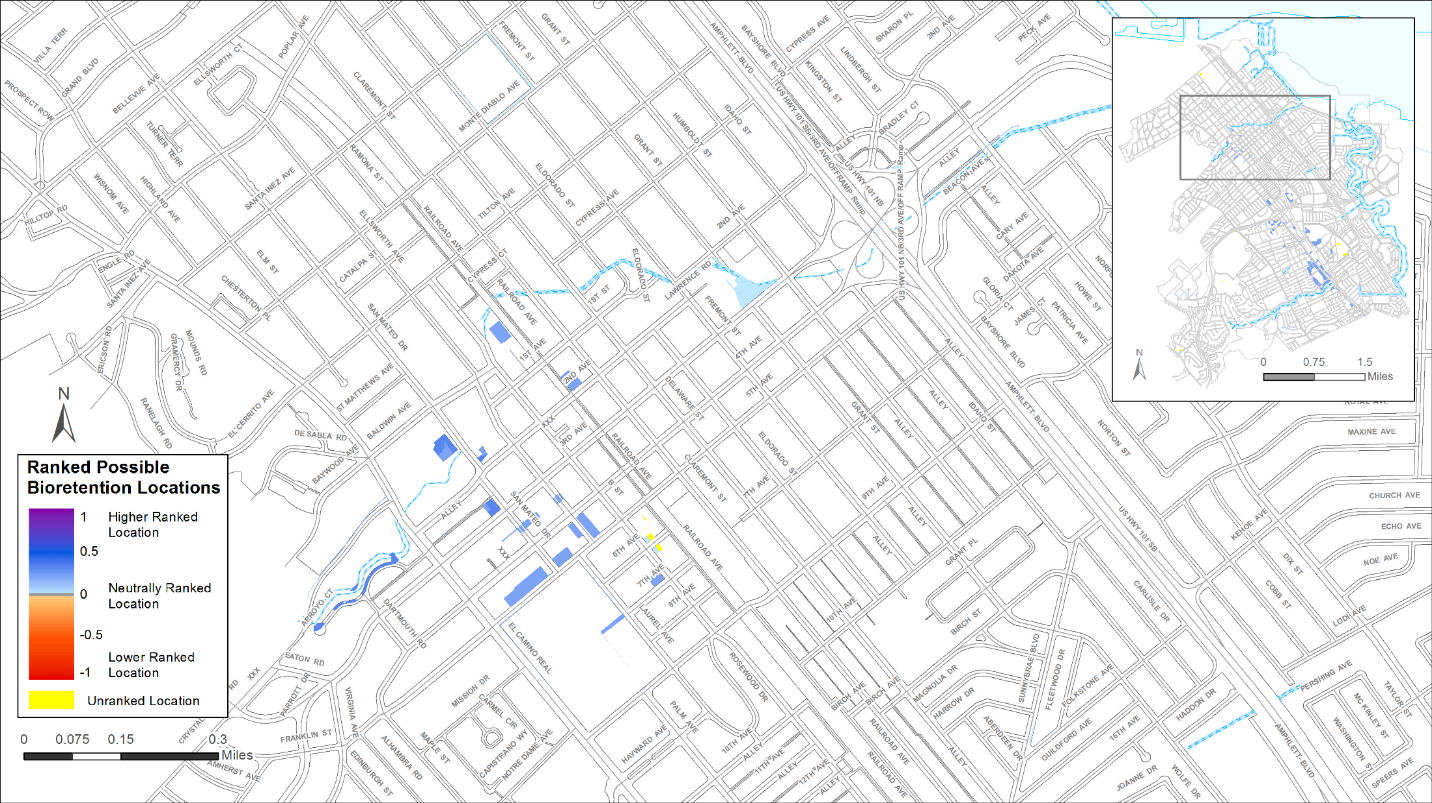
Running the Site Locator Tool with the City of San Mateo was an iterative and interactive process. The first round of conversations with the City focused on identifying street data that had spatial attributes for measuring existing street width. During subsequent conversations, additional data sets such as existing and potential pedestrian trails, sidewalk width, areas of existing sidewalk planters, and regional bike facilities in or identified as additional data that captured certain aspects of the Sustainable Streets Plan. This progression shows how GIS data layers can be added and removed, rankings and data layer weights can be changed. Additionally the Tool can be rerun by including or excluding any of the analyses. This iterative process can be refined as questions and goals change or more accurate local data are available. Based on selected regional and local data layers and the City’s ranking and weighting of these layers, the Site Locator Tool identified 18 acres of City-owned property or right-of-way as highly ranked locations for potential GI implementation, 113 acres as moderately ranked, and 11 acres as lower ranked locations (Figure 2-3). In total, 142 acres were identified as potential locations for Green Infrastructure. Higher ranked sites were the result of relatively higher factor weights on Priority Development Areas and funding opportunity data layers.
Table 2-2. Local and regional GIS data layers included in the Site Locator Tool for the City of San Mateo.
|
GIS Data Layer Name |
GIS Data Layer Description |
Data Layer Type |
Analysis |
|---|---|---|---|
|
Sidestreet parking |
Side Parking polygons on one lane streets (Where Width from Street Saver data* allowed for the minimum dimentions of lanes, medians and parking spaces for each street type and context from the San Mateo Sustainable Streets report) |
Regional/Local |
Locations |
|
Sidestreet parking |
Side Parking polygons on one lane streets (Where There is no Width value from Street Saver data and the minimum dimentions of all street comonants for each street type and context from the San Mateo Sustainable Streets report is assumed) |
Regional/Local |
Locations |
|
Sidestreet parking |
Side Parking polygons on multi lane streets (Where Width from Street Saver data* allowed for the minimum dimentions of lanes, medians and parking spaces for each street type and context from the San Mateo Sustainable Streets report) |
Regional/Local |
Locations |
|
Sidestreet parking |
Side Parking polygons on multi lane streets (Where There is no Width value from Street Saver data and the minimum dimentions of all street comonants for each street type and context from the San Mateo Sustainable Streets report is assumed) |
Regional/Local |
Locations |
|
Sidewalk |
Sidewalk Polygons (Where the width attribute from the San Mateo Sidewalk layer allows for the mimimum dimentions of sidewalk compoents for each street type and context according to the San Mateo Sustainable Streets report and allowed for a GI installation in the sidewalk furniture zone) |
Local |
Locations |
|
Sidewalk |
Sidewalk Polygons (Where there is no width attibute from the San Mateo Sidewalk layer, and minimum dimention of sidewalk compoents from the San Mateo Sustainable Streets report are assumed). |
Local |
Locations |
|
Parking lot |
Parking Facilities quried from San Mateo's facility polygon layer |
Local |
Locations |
|
Pedestrian Trails |
San Mateo's Pedestrian Trail layer buffered 2 ft on both sides (4 ft wide) |
Local |
Locations |
|
Potential Pedestrian Trails |
San Mateo's Potential Pedestrian Trail layer buffered 2 ft on both sides (4 ft wide) |
Local |
Locations |
|
Parking_OSM |
Parking polygons querried from SF Bay OSM polygons (downloaded in August 2014) |
Regional |
Locations |
|
Parks_OSM |
Park polygons querried from SF Bay OSM polygons (downloaded in August 2014) |
Regional |
Locations |
|
CPAD_Areas |
California Protect Areas Database Polygons for the Bay Area |
Regional |
Locations |
|
Sidewalk planter |
Sidewalk Polygons that have a planter width value of 4ft or more |
Local |
Locations |
|
Sidewalk |
Sidewalk Polygons that have a width value of 8ft or more |
Local |
Locations |
|
Priority Development Areas |
Bay Area Wide Priority Development Areas from ABAG |
Regional |
Opportunities and Constraints |
|
Storm Line |
A 25 ft. buffer from the San Mateo Storm Line layer |
Local |
Opportunities and Constraints |
|
Storm Line |
A 50 ft. buffer from the San Mateo Storm Line layer |
Local |
Opportunities and Constraints |
|
Catch basin |
A 25 ft. buffer from the San Mateo Storm Catch Basin Layer |
Local |
Opportunities and Constraints |
|
Street Trees |
A 20 ft. buffer from the San Mateo Urban Tree layer |
Local |
Opportunities and Constraints |
|
large trees ( > 20) |
A 30ft buffer around trees that are over 20ft in circumference from the San Mateo Urban Tree layer |
Local |
Opportunities and Constraints |
|
Street Lights |
A 15ft buffer around street lights from the San Mateo Street Light layer (+5ft for spatial inacuracies between layers) |
Local |
Opportunities and Constraints |
|
Narrow Street_Fire Running Lanes |
A 40 ft. buffer from a selection from the San Mateo Fire Running Lane layer (streets that were less than or equal to 40 ft. wide accounting for spatial inaccuracies in the data layers used) |
Local |
Opportunities and Constraints |
|
Regional Bike Facilities |
A 15 ft. buffer from the Bay Wide Regional Bike Facilities Layer from MTC (+ 25ft to account for spacial inacuracies between layers) |
Regional |
Opportunities and Constraints |
|
Streetside parking |
A Road polygon later create from San Mateo road centerlines buffered half width of that road (Street Saver data* width) taken from the San Mateo location street layer, where the width from Street Saver data* allows for the minimum width of street components for that particular street type and context as well as the minimum width of a bike lane |
Regional/Local |
Opportunities and Constraints |
|
Damaged Streets |
A Road polygon layer (San Mateo road centerline buffered by half of that street's width according to Street Saver data*) where PCI is less than or equal to 40, indicating that they are damaged roads and may need to be repaired soon |
Local |
Opportunities and Constraints |
|
Damaged Sidewalk |
San Mateo Sidewalk polygons that are indicated as having damaged curbs, gutter and or sidewalks |
Local |
Opportunities and Constraints |
|
GreenWay Network |
San Mateo pedestrian priority green way corridor from Ken Chen, Sep 2014 (buffered 85 feet to account for spatial inacuracies and missalignment of layers.) |
Local |
Opportunities and Constraints |
|
Streams |
A 500ft buffer from a subset of San Mateo's Stream layer where no Streams intersect San Mateo's Lake layer |
Local |
Opportunities and Constraints |
|
Lakes |
A 400ft buffer from San Mateo's Lake polygon layer |
Local |
Opportunities and Constraints |
|
Schools |
A 100ft buffer from San Mateo's School polygon layer |
Local |
Opportunities and Constraints |
|
Libraries |
A 100ft buffer from San Mateo's Library polygon layer |
Local |
Opportunities and Constraints |
|
City Hall |
A 100ft buffer from City Hall polygons selected from San Mateo's Facility polygon layer |
Local |
Opportunities and Constraints |
|
parks |
A 100ft buffer from a subset of San Mateo's Facility polygon layer where FACTYPE is = to "PARK" |
Local |
Opportunities and Constraints |
|
City-owned parcels |
San Mateo's city owned parcel layer |
Local |
Ownership |
|
CARI Wetlands |
CARI Wetland polygons: see http://www.sfei.org/it/gis/cari |
Regional |
Knockout |
|
SM_Lagoon |
Lagoon Layer from San Mateo |
Local |
Knockout |
Figure 2-3 Map output of ranked potential bioretention locations in the City of San Mateo. Higher ranked locations are dark blue, lowest ranked locations are red and yellow designates unranked areas due to lacking data in those places
San Mateo and SFEI performed a remote data validation exercise in order to see how the Tool ranked areas previously identified for potential GI implementation. Specifically, Grant Street and Fremont Street were investigated to determine why one street ranked higher than the other. Grant Street was ranked higher than Fremont Street since it had a planned bike lane, which was given a higher weight in the Opportunities and Constraints Analysis. Delaware Street and Bay Meadows were unranked in the output because they were excluded as possible locations due to site characteristics deemed not feasible for implementing GI. Overall, many of the sites identified and ranked highly by the locator tool were also sites that were previously identified as potential GI opportunities by San Mateo. Furthermore, additional high ranked locations were identified which provided the City with additional locations to investigate further and to compare to the current GI plan.
Case Study: San Jose’s Urban Villages
Chapter 3
The city of San Jose is the largest municipality in the Bay area with an area of 180 square miles and a population of over 1 million people (Figure 3-1). Like many cities in the region, San Jose has undergone significant growth over time and experienced environmental issues typically associated with urbanization including increased loadings of sediment, PCBs, mercury, and pathogens. The City is regulated by the Municipal Regional Stormwater NPDES Permit (MRP), and stormwater management is a driver for a number of City activities and area-wide programs.
In compliance with the MRP, the City is currently implementing four green street projects in various stages of construction and design. The City is also continuing to look for opportunities to integrate GI features into existing infrastructure and planning efforts. Envision San Josè 2040, the City’s current General Plan promotes the development of Urban Villages (Figure 3-1) which are active, walkable, bicycle-friendly, transit-oriented, mixed-use urban settings for new housing and job growth attractive to an innovative workforce and consistent with the plan's environmental goals. The urban village strategy fosters: 1) Mixing residential and employment activities; 2) Establishing minimum densities to support transit use, bicycling, and walking; 3) High-quality urban design; and 4) Revitalizing underutilized properties with access to existing infrastructure[1]. Within the development area of the proposed Urban Village, the City is planning to retrofit existing facilities and incorporate new stormwater treatment to address stormwater planning needs, MS4 and TMDL requirements, and local stakeholder concerns.
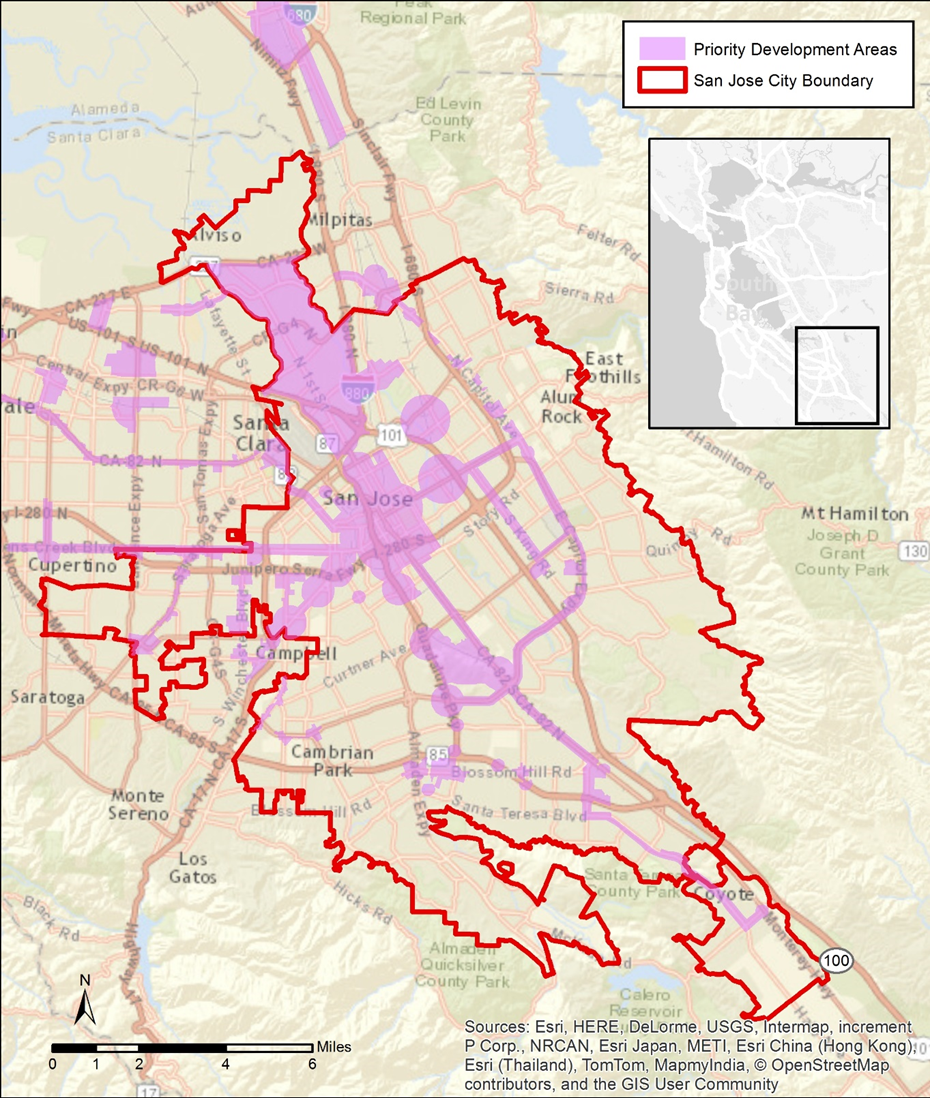
Figure 3-1 City of San Jose and Proposed Urban Villages
3.1 Case Study Objective
To plan for current and future effort to incorporate GI at the City’s landscape, the City needed a planning tool to help determine areas of opportunity and constraint for implementing GI on a wide scale and embraced the GreenPlan-IT Toolkit as a Tool that meets their needs. In discussions with SFEI, the city staff decided to use the redevelopment of the Urban Village as a case study area to test the applicability of the Toolkit. The objective of the pilot study was to demonstrate the capacities and usability of the GreenPlan-IT Toolkit in identifying feasible and cost-effective GI locations at a watershed scale. Results from the Toolkit application will be used to: 1) identify specific green infrastructure projects; 2) support the City’s current and future planning efforts, such as the development of the San Jose Storm Drain Master Plan; and 3) help comply with future Stormwater Permit requirements. At the end of the pilot study, the city staff hoped to have opportunity maps of possible GI locations, a cost-effectiveness curve for flow or pollutant reduction, and a workable Toolkit that can be used for future GI planning efforts.
The downtown area and north San Jose were identified as environmentally and fiscally beneficial locations to develop some of the Urban Villages (Figure 3-1). The majority of this proposed new development is located within the lower part of the Guadalupe River Watershed (Figure 3-2). In consultation with the city staff, the lower part of the Guadalupe watershed was selected for the development of a GreenPlan-IT Toolkit case study. Data are available in this watershed to support the full application of the Toolkit.
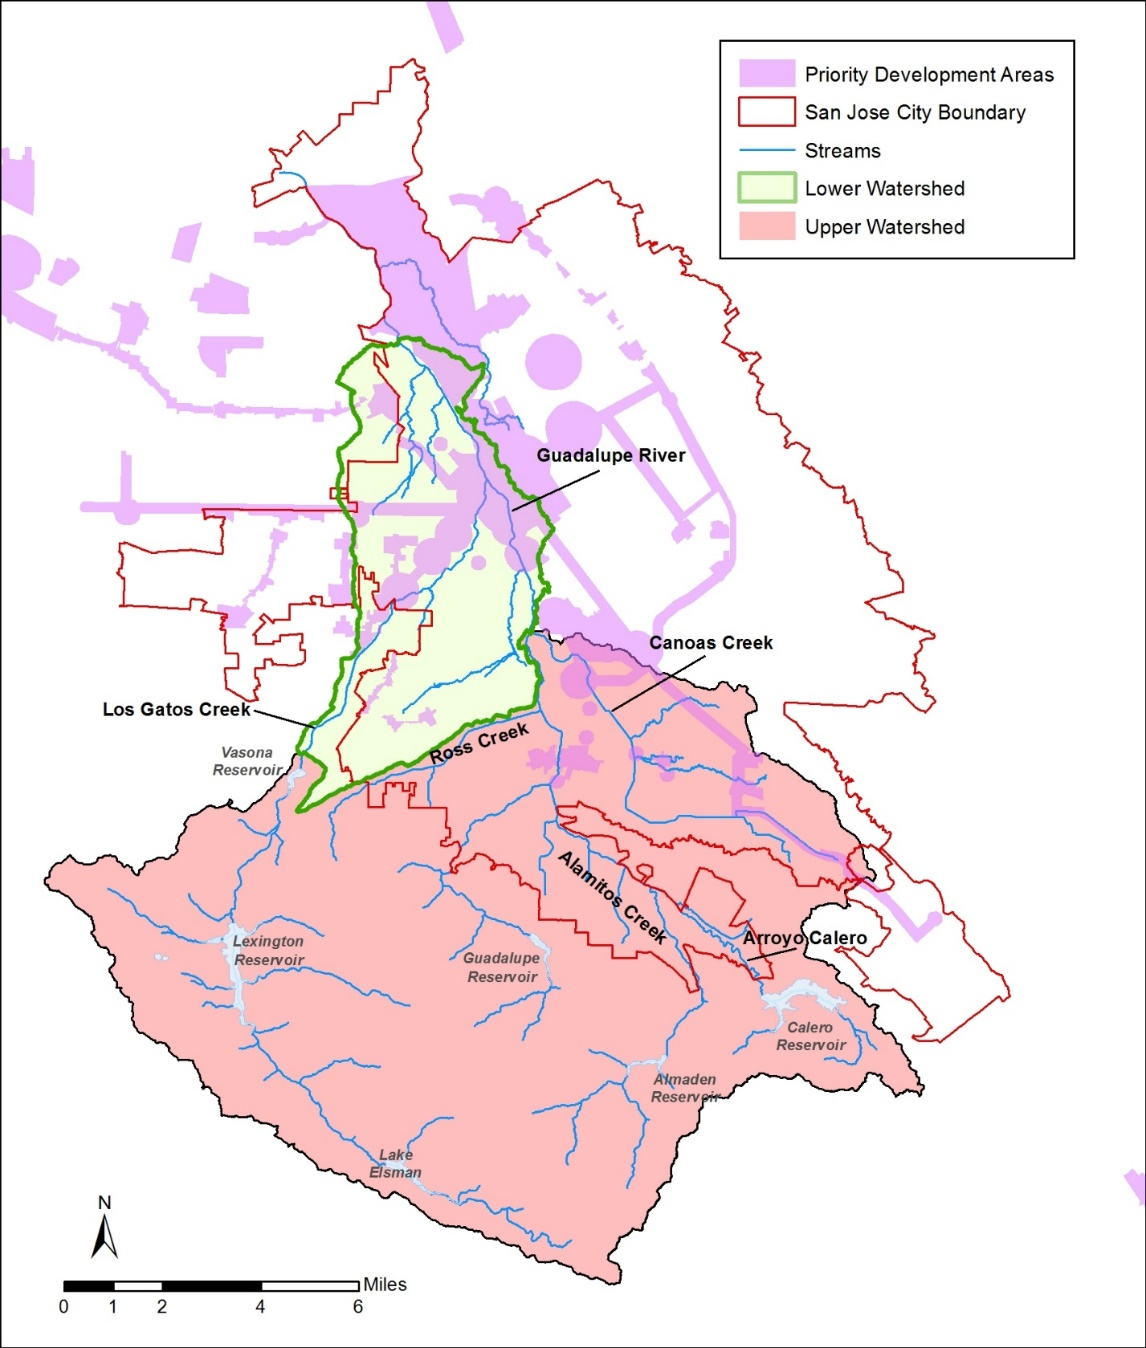
Figure 3-2 Guadalupe River Watershed and Proposed Urban Villages
3.2 Project Setting
The Guadalupe River Watershed is located in the Santa Clara Valley basin and drains to Lower South San Francisco Bay (Figure 3-2). The watershed is the fourth largest in the Bay Area with approximately 170 mi2 of total drainage area. Five main tributaries drain to the Guadalupe River. Six water conservation and storage reservoirs in the watershed provide varying amounts of flood control. The Guadalupe Watershed has a mild Mediterranean-type climate generally characterized by moist, cool wet winters and warm dry summers. Rainfall follows a seasonal pattern with a pronounced wet season that generally begins in October or November and can last to April or May, during which an average of 89% of the annual rainfall occurs (McKee et al., 2003).
The primary focus of this case study is downtown San Jose, and accordingly, the watershed boundary was adjusted to exclude upstream watersheds where gauge data are available to be included as boundary conditions for the appropriate streams and/or sub-watersheds (Figure 3-2). The resulting study area is referred herein as the Lower Guadalupe River watershed with an area of 18,613 acres.
3.3 Site Locator Tool: Data layers used and decision process
The GIS Site Locator Tool integrates regional and local GIS data and uses these data, through an identification, ranking and weighting process, to locate potential GI locations at a watershed scale. Data accuracy is an important determinant in the accuracy of map outputs produced by the Tool. The quality, scale and accuracy of the input data will determine the quality, scale and accuracy of the output maps. Therefore, it is highly beneficial to use more accurate and local data when available. When using more regional scale data layers for analyses, such as the opportunities and constraints ranking analysis, the user can weight and rank these layers to reflect the confidence in local accuracy of the data. There are many regional GIS data that are included in the Tool (Table 3-1) and additional regional data sets can be added as well. Local data sets can be added to the Tool in order to help identify potential locations that meet the goals and planning needs of each city. Each municipality will identify a set of questions or goals to answer or meet prior to running the Tool. These questions or goals become the drivers for deciding which data sets to include.
Table 3-1. Regional GIS data layers included in the Site Locator Tool.
|
GIS Data Layer Name |
GIS Data Layer Description |
|
CPAD_2014a2_Holdings |
California Protected Areas database released in the first half of 2014 |
|
FEMA_NFHL |
National Flood Hazard Layers for all BA counties |
|
Employment_Investment_areas_SCS |
From ABAG's data webpage |
|
Priority Development Areas_Current |
From ABAG's data webpage. Priority Development Areas (Current) - This feature set contains changes made to Priority Development Areas since the adoption of Plan Bay Area. DO NOT USE this feature set for mapping or analysis related to Plan Bay Area. |
|
K_12_Schools |
Schools in the bay area (point data) |
|
NLCD2011_PercentImpervious |
Percent Impervious data from the 2011 National Land Cover Dataset |
|
OSM_Buildings |
Open Street Map layer for the Bay Area _Late2014 |
|
OSM_Libraries |
Open Street Map layer for the Bay Area _Late2014 |
|
OSM_Parking |
Open Street Map layer for the Bay Area _Late2014 |
|
OSM_Parks |
Open Street Map layer for the Bay Area _Late2014 |
|
OSM_Schools |
Open Street Map layer for the Bay Area _Late2014 |
|
OSM_Streets |
Open Street Map layer for the Bay Area _Late2014 |
|
R2_CARI_PublicV |
California Aquatic Resource Inventory for Region 2 |
|
Regional_Bike_Facilities_Bay |
Regional bike facilities for the Bay Area |
|
RWQC_RB_2 |
Region 2 Water Board Boundary |
The primary drivers for GI implementation in the City of San Jose are the redevelopment Urban Villages plan and the Storm Drain Master plan. As noted previously, the Urban Villages plan focuses redevelopment in downtown San Jose for walkability, bikeability, access to public transit, and employment. The Storm Drain Master plan is a large-scale effort to analyze deficiencies in the stormwater drainage network (both storm drain and natural drainage) and provide long-term solutions to the identified deficiencies. The Plan’s goals are to improve water quality, provide flood protection, enhance and protect habitat, and increase stormwater infiltration. Together, these plans provide the pathway for future GI implementation.
San Jose also requested that infiltration trenches be added to the RBA. The Santa Clara Valley has suitable soils for infiltration to groundwater and regional large-scale infiltration trenches are being considered as one mechanism for groundwater recharge. This feature type was added and ranked for each of the five existing metrics (slope, depth to groundwater, soil type, land use, and risk of liquefaction) used for determining suitable locations.
During the first analysis for the City, potential locations were focused on parks, city-owned parcels, wide streets, existing sidewalk planters, and parking lots as potential locations for GI implementation. Formulas were developed, using existing City data, to identify streets and sidewalks with appropriate widths for implementation of bioretention features and parking lots greater than 7000 ft.². The City identified planning opportunities such as areas planned for redevelopment (PDAs), existence of stormwater infrastructure, and planned bikeways as well as constraints to GI implementation including proximity to riparian areas and gas mains. These opportunities and constraints were then categorized into factors (local development opportunities, community needs, conservation, and installation feasibility). These factors were then weighted to produce a relative ranking of areas for potential GI implementation. Community needs and local development opportunities were given the highest weight.
The City also included a data layer that identified City-owned parcels in the ownership analysis which allowed for a public/private delineation of locations in the map outputs (Table 3-2). For the Knockout Analysis, The City excluded all areas intersecting existing wetlands and proximity to other waterbodies (salt ponds, existing percolation ponds, and a 10ft buffer from creek centerlines) as well as existing GI features. The first Tool run included map outputs for bioretention units, permeable pavement, and infiltration trenches. This first run identified approximately 400 acres of moderate to highly ranked areas for potential GI implementation.
After review of the preliminary Tool outputs, city of San Jose staff decided that a second analysis, with modifications made to a few analyses, could help refine their output (Table 3-2). In particular, the City wanted to run the Tool while both including and excluding the Regional Base Analysis (two separate Tool runs). By excluding the RBA, additional locations were included in the analysis and in the map outputs. No new additions were made to the Locations Analysis while there were changes made to the Opportunities and Constraints Analysis. A data layer delineating Urban Villages was added and more heavily weighted in the local development opportunity factor. San Jose’s three-year re-pavement plan was also added and the RBA was added and ranked in lieu of running the RBA at the start of the analysis. Constraints were also removed from this analysis and layer and factor weights recalculated. Installation feasibility (existing storm drain infrastructure) was the highest weighted factor followed by local development opportunities, and community needs (planned bike paths). The City also added additional data to the Knockout Analysis including existing salt ponds and building footprints.
Table 3-2 shows the regional and local GIS data layers included in the Site Locator Tool for the City of San Mateo.
|
GIS Data Layer Name |
GIS Data Layer Description |
Data Layer Type |
Analysis |
|---|---|---|---|
|
Parks |
Layer of city parks |
Local |
Locations |
|
Sidestreet parking |
Data layer identifying streets with on-street parking |
Local |
Locations |
|
Sidewalk planter |
Data layer identifying existing sidewalk planters |
Local |
Locations |
|
Parking lot |
Data layer identifying parking lots with building footprints removed |
Regional |
Locations |
|
City-owned parcels |
Data layer identifying city owned property |
Local |
Locations |
|
Priority Development Areas |
Bay Area Wide Priority Development Areas from ABAG |
Regional |
Opportunities and Constraints |
|
Urban Villages |
Areas within the city of San Jose designated for development of urban villages |
Local |
Opportunities and Constraints |
|
Stormwater infrastructure |
Locations of stormwater mainlines buffered 80 ft |
Local |
Opportunities and Constraints |
|
Stormwater infrastructure |
Locations of stormwater manholes buffered 90 ft |
Local |
Opportunities and Constraints |
|
Stormwater infrastructure |
Locations of inlets to storm drain network buffered 60 ft |
Local |
Opportunities and Constraints |
|
Planned bikeways |
Layer showing all planned bikeways buffered 80 ft |
Local |
Opportunities and Constraints |
|
Repavement plan |
City of San Jose replacement plan buffered half of the street Face of Curb width |
Local |
Opportunities and Constraints |
|
CARI wetlands |
Wetland locations from CARI |
Regional |
Knockout |
|
Building footprint |
San Jose building footprint data layer |
Local |
Knockout |
|
Creek buffer |
Santa Clara Valley Water District 10 ft buffer for existing creeks and riparian areas |
Local |
Knockout |
|
Percolation pond |
Santa Clara Valley Water District percolation ponds data layer |
Local |
Knockout |
|
Various waterbodies |
Other waterbodies for exclusion |
Local |
Knockout |
|
Existing salt ponds |
Santa Clara Valley Water District existing salt ponds data layer |
Local |
Knockout |
|
data\SanJoseDatasets.gdb\OM_Inventory |
Data layer showing locations of existing green infrastructure |
Local |
Knockout |
|
Schools |
San Jose school data layer |
Local |
Knockout |
|
City-owned parcels |
San Jose city-owned parcels |
Local |
|
3.1 Site Locator Tool Results
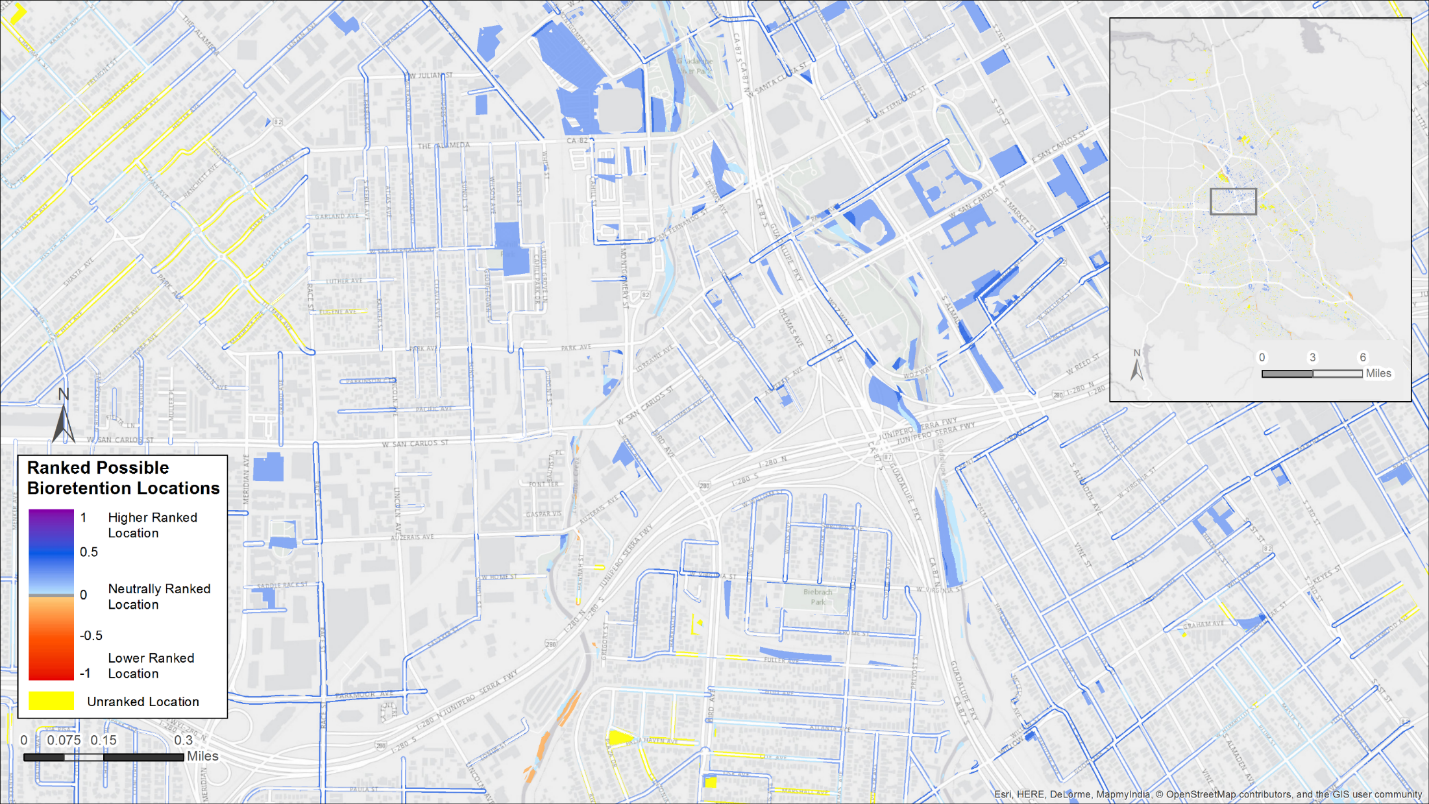
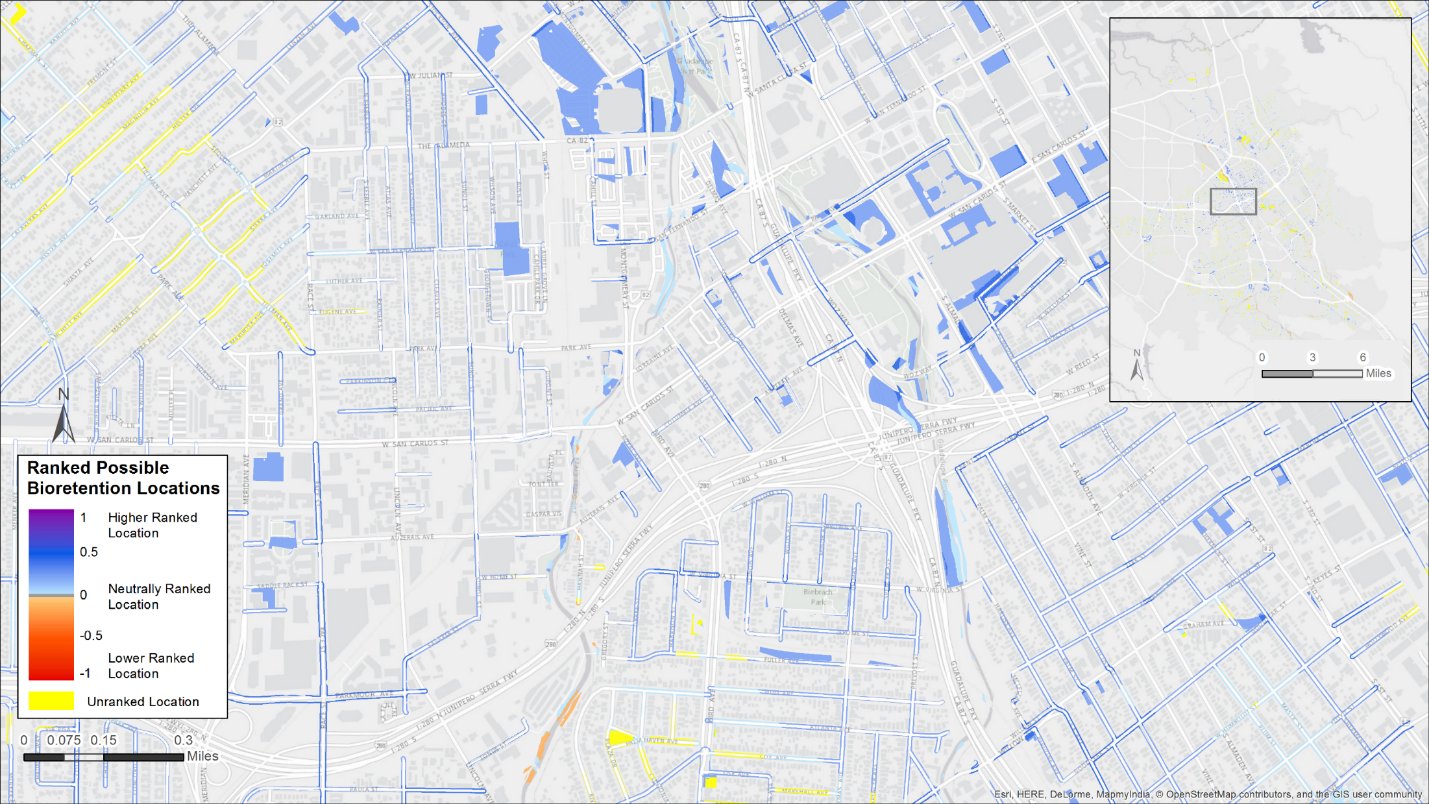
During the last Tool iteration, City staff requested two Tool runs. The first run included the RBA as designed while the second run added the RBA to the Opportunities and Constraints Analysis where it was ranked and weighted. In the second run, the RBA was not included at the start of the analysis. The first run excluded many possible areas that did not meet the criteria underlying the RBA. For the second run, (including the RBA layers in a later analysis), the relative importance of these criteria can be controlled through the weighting process. City staff found the map outputs from the second analysis more helpful in the process of identifying possible GI locations as it allows for viewing all locations but provides the relative ranks for locating highest opportunity sites. Each iteration of the Tool analysis produced a map with ranked possible locations for bioretention, infiltration trench, and pervious pavement implementation (Figure 3-3). For bioretention, the final map output had a total of 9840 acres ranked from low to high potential. Eighy-five acres were highest ranked (a rank greater than 0.4), while 1705 acres were moderately ranked (a rank between .4 and .2), 3489 acres were ranked relatively low (a rank below .2), and 4559 acres were unranked.
Once the final output was produced, City staff reviewed maps through the lens of the Urban Villages planning efforts as well as other GI planning efforts. One way in which the Tool maps can be helpful is to show alternative locations when particular constraints are identified in planned locations. San Jose was exploring 5th Street and Hedding Street as a potential GI location. This location was ranked relatively lower on the map output due to the street not having an existing storm drain. City staff gave storm drain infrastructure the highest categorical weight in the analysis which resulted in the 5th and Hedding Street area being ranked relatively lower. However during review of the map outputs, a more suitable, and relatively higher ranked, location was identified nearby at 6th and Hedding.
This remote ground truthing is an important step in the process. This can also be combined with a field ground truth effort. The field effort provides real world syntax to how the Tool performed and also identifies other opportunities and constraints that the Tool didn’t capture (due to lacking data or the weighting process). City staff participated in a field ground truthing effort with the Project team. Three locations were visited: Tully Road and 7th Street, Chynoweth Avenue, and the corner of Round Table Drive and Roeder Road. The Tully Road site was identified by the Tool based on a large road median with curbed boundaries. The median is bordered by a busy three lane road, an access turn lane, and a smaller infrequently used one lane road. Discussions at the site centered on drainage patterns to existing storm drains and the potential opportunity to close the one lane road to create a larger GI feature. The Chynoweth site is already in the planning process for bioretention implementation. Site discussions centered on drainage patterns and where bulb outs could be placed. The corner of Round Table Drive and Roeder Road was selected by San Jose Staff as it was a highly ranked location that fell within an Urban Village area. This location was selected in order to demonstrate how the tool could be used to identify locations that had not previously been identified, that also met many of the City’s priorities and criteria for highly suitable locations. Outputs from the Site Locator Tool were then used in the Optimization Tool as described below.
Figure 3.3 Map output of ranked potential bioretention locations in the City of San Jose. Higher ranked locations are dark blue, lowest ranked locations are red and yellow designates unranked areas due to lacking data in those places.
3.6 Modeling Tool
The application of the Modeling Tool involved input data collection, model setup, model calibration, and finally the establishment of a baseline condition.
3.6.1 Data Collection
A large amount of data were collected to support the development of the Modeling Tool.
The input data that were used for developing a SWMM5 model of runoff for Lower Guadalupe River watershed are described below.
- Precipitation Data
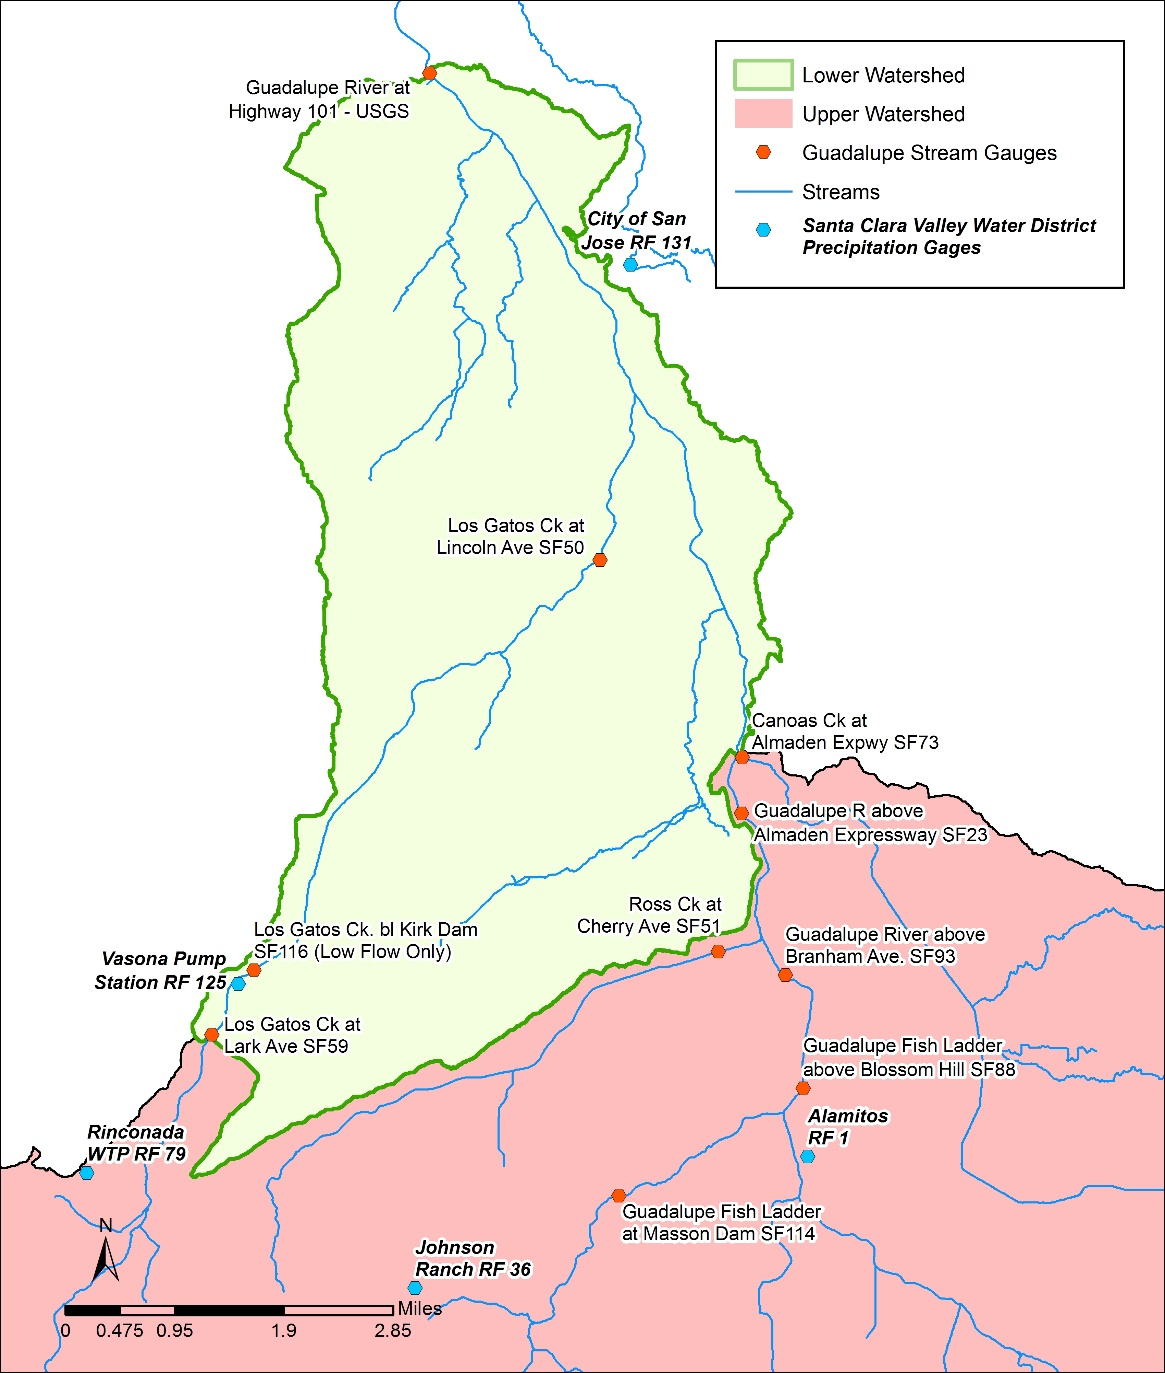
The Guadalupe River Watershed is instrumented with numerous meteorological and hydrology stations (Figure 3-4). There are 11 precipitation stations operated by the Santa Clara Valley Water District (SCVWD) and the National Oceanographic and Atmospheric Administration (NOAA). There is a pan evaporation station, which is operated by SCVWD, and an evapotranspiration station, which is operated by California Irrigation Management Information Systems (CIMIS). High-resolution precipitation data (15-minute intervals) were obtained from SCVWD for 3 precipitation gauges-RF1, RF125, and RF-131, located within the Lower Guadalupe watershed (Figure 3-3). The rainfall data from 2010 to 2011 was chosen for model calibration, representing average and dry years. Annual rainfall for each precipitation station is shown in Table 3-3. The precipitation records were analyzed and compared and the Thiessen polygon method was used to assign representative weather stations to sub-basins.
- Evaporation Data
Evaporation is not as spatially or temporally variable as precipitation; hence lower resolution data from more remote sources are adequate for modeling evaporation. Monthly evaporation data for year 2010-2011 at Los Alamitos Recharge Facility in San Jose was obtained from SCVWD (Table 3-4). These data were then converted to monthly average in inches/day as required by the SWMM5 model.
- Land Use Data
The SWMM5 model requires input of land use percentages for each segment to define hydrology and pollutant loads. Land use data was were obtained from the Association of Bay Area Governments (ABAG) 2005 land GIS coverage. The coverage contains 11 different land use classifications, which were than aggregated down to six model categories. The aggregated land use groups for the SWMM5 model and their percentages are listed in Table 3-5.
- Percent of Imperviousness
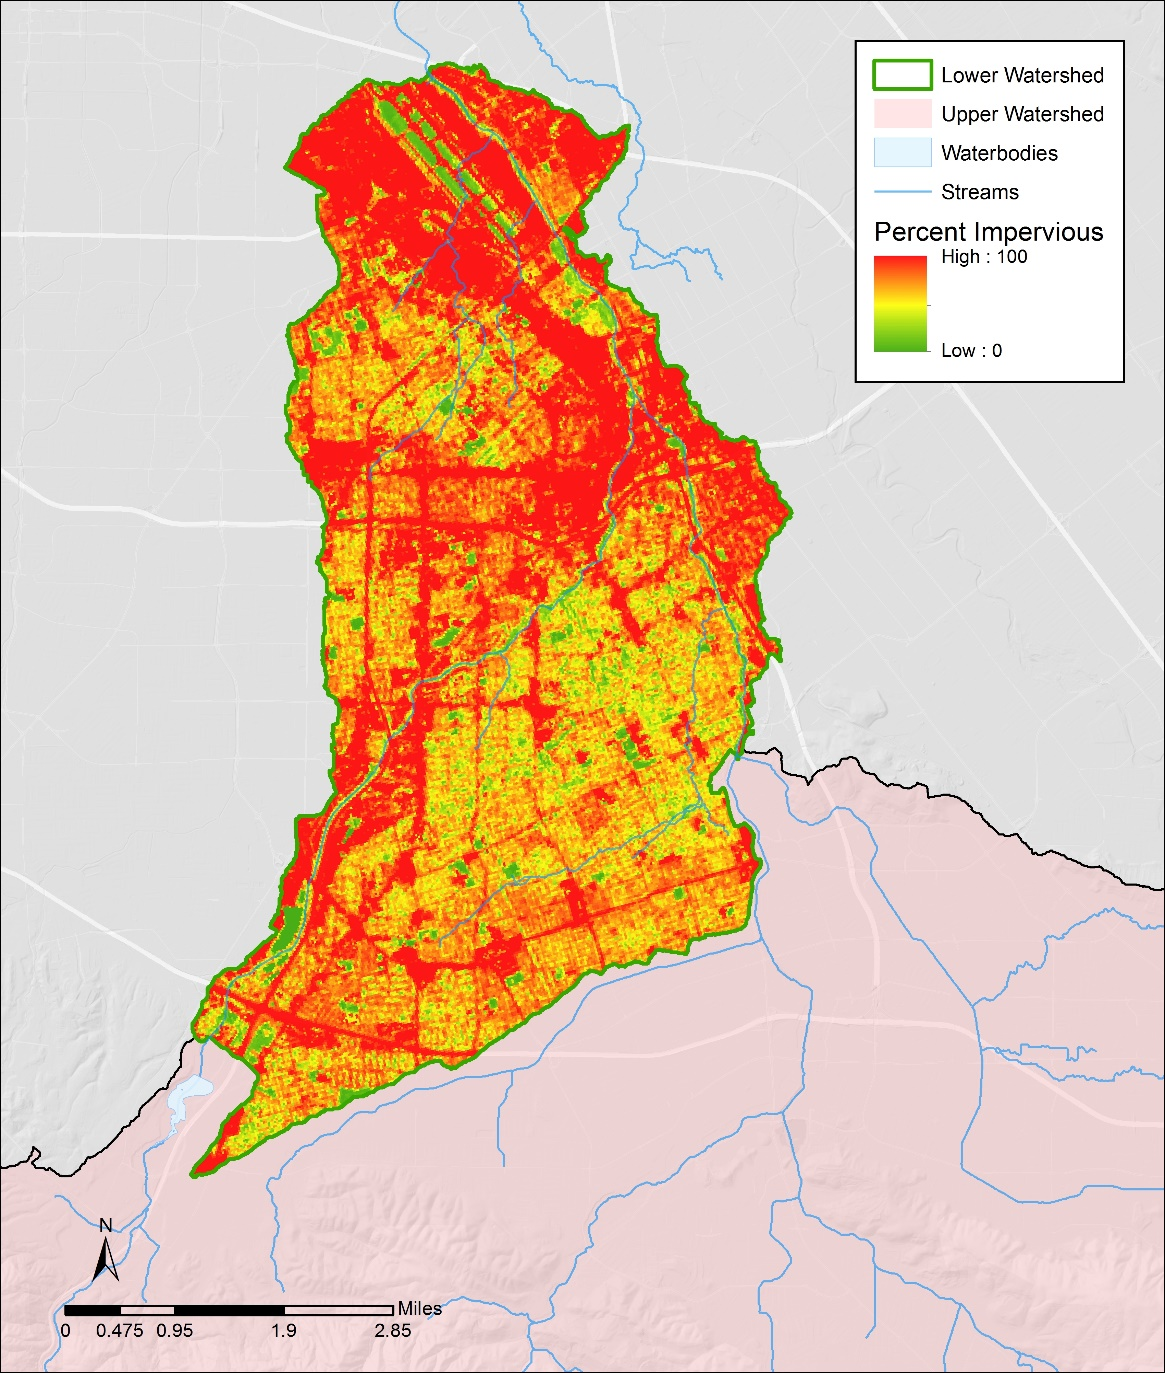
The percent of imperviousness is an import input data set for SWMM5 hydrology simulation. The GIS layer of imperviousness was from National Land Cover Dataset (NLCD) 2011, which covers the entire lower 48 State at a spatial resolution of 30m pixels (http://www.mrlc.gov/nlcd2011.php). The distribution of impervious land use for Lower Guadalupe watershed is shown in Figure 3-5.
Figure 3-4 Rain gauges and Stream gages in Lower Guadalupe Watershed
Table 3-3 Annual Rainfall (inches) for Precipitation Stations
Figure 3-5 Percent of Imperviousness for Lower Guadalupe River Watershed
- Soil Data
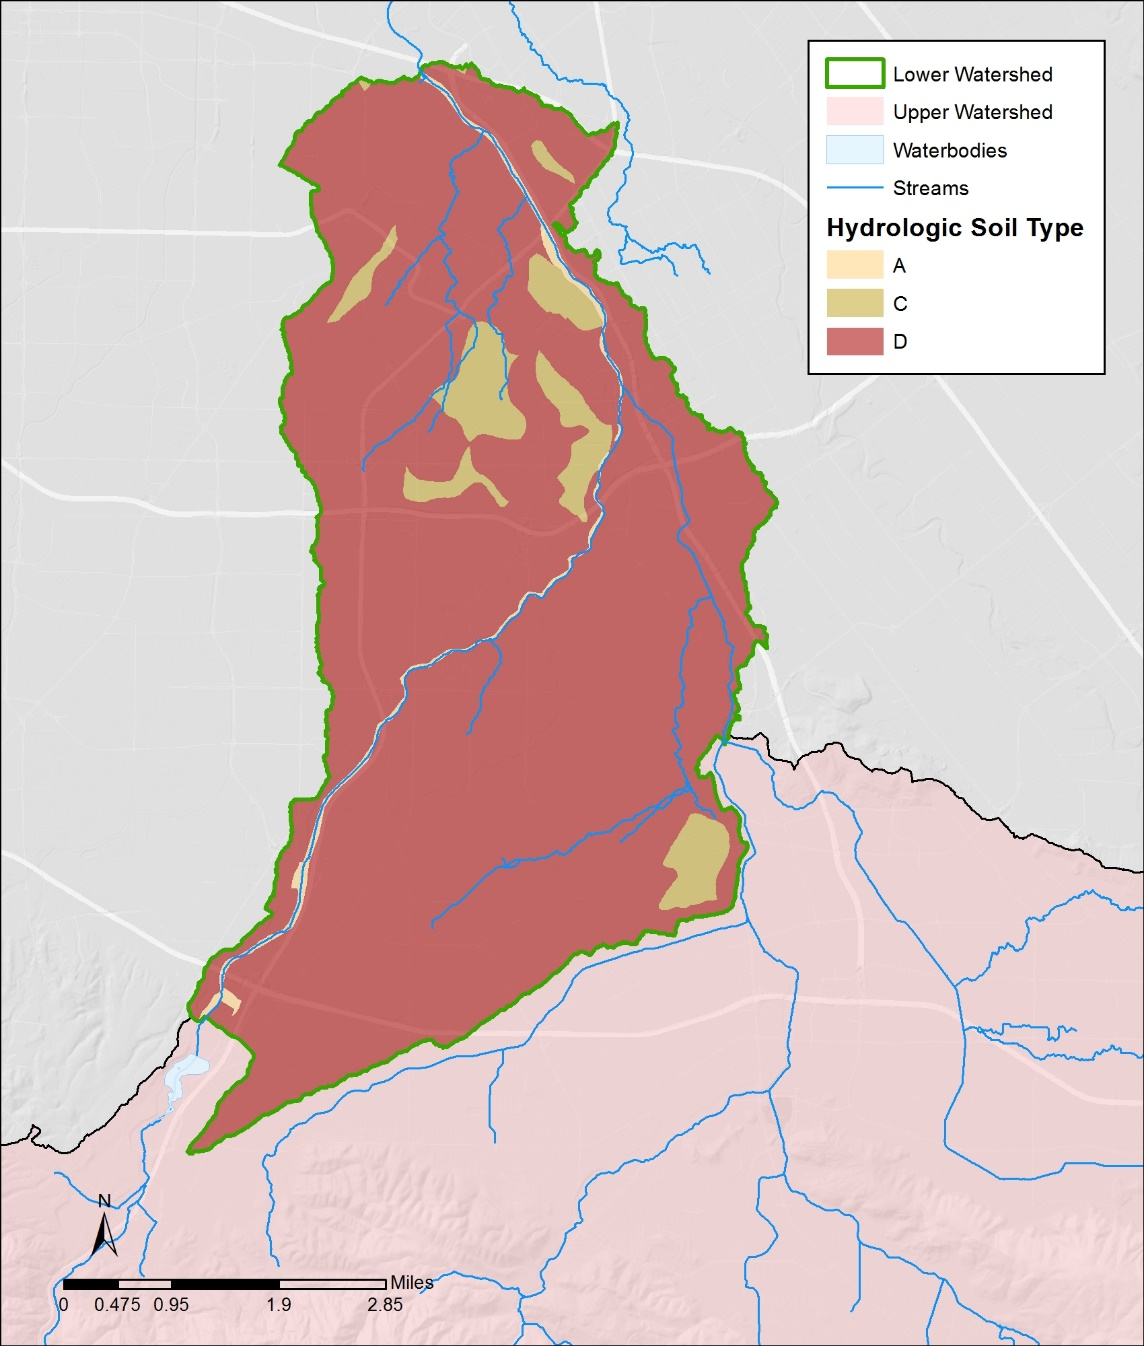
Soil data were obtained from the State Soil Geographic Database (STATSGO) and intersected with the subbasin boundary layer to determine the percentages of each soil group for each model segment. STATSGO soils information include the hydrologic soil group (A, B, C, or D) that indicates the ability of the soil to infiltrate water. Soil type can have significant effects on the annual runoff volumes and the peak runoff rates. The Lower Guadalupe River watershed is mainly comprised of D type soils with low infiltration rates and high runoff rates (Figure 3-6).
Figure 3-6 Soil Map for Lower Guadalupe River Watershed
- Inflow from Upstream
Flow data for the upstream of the Lower Guadalupe watershed were obtained from three gages at the watershed boundary. Continuous streamflow record (15 minutes interval) from 2010 -2011 was obtained from the SCVWD for stations SF23, SF73, SF59 (Figure 3-4). These data serve as the upstream boundary condition and are input into connected model segments as time series.
- Diversion Data
SCVWD operates a fairly complex water supply system in the Guadalupe River watershed that consists of storage reservoirs, ditches, percolation ponds, and pipelines. Within the modeled area, there are two gauged ditches that divert water from Los Gatos Creek. Daily flow diverted from these ditches was obtained from SCVWD for year 2010-2011. This flow was counted as loss and subtracted from inflow from station SF59.
- Calibration Data
Monitored flow data from 2010 to 2011 at two gages within the model domain were used for model calibration. Daily flow at station SF50 were provided by SCVWD. Flow from the USGS station at highway 101 were downloaded from USGS site http://ca.water.usgs.gov/data/. The USGS station receives water from the entire watershed and is the focal point of model calibration.
3.6.2 Model Setup
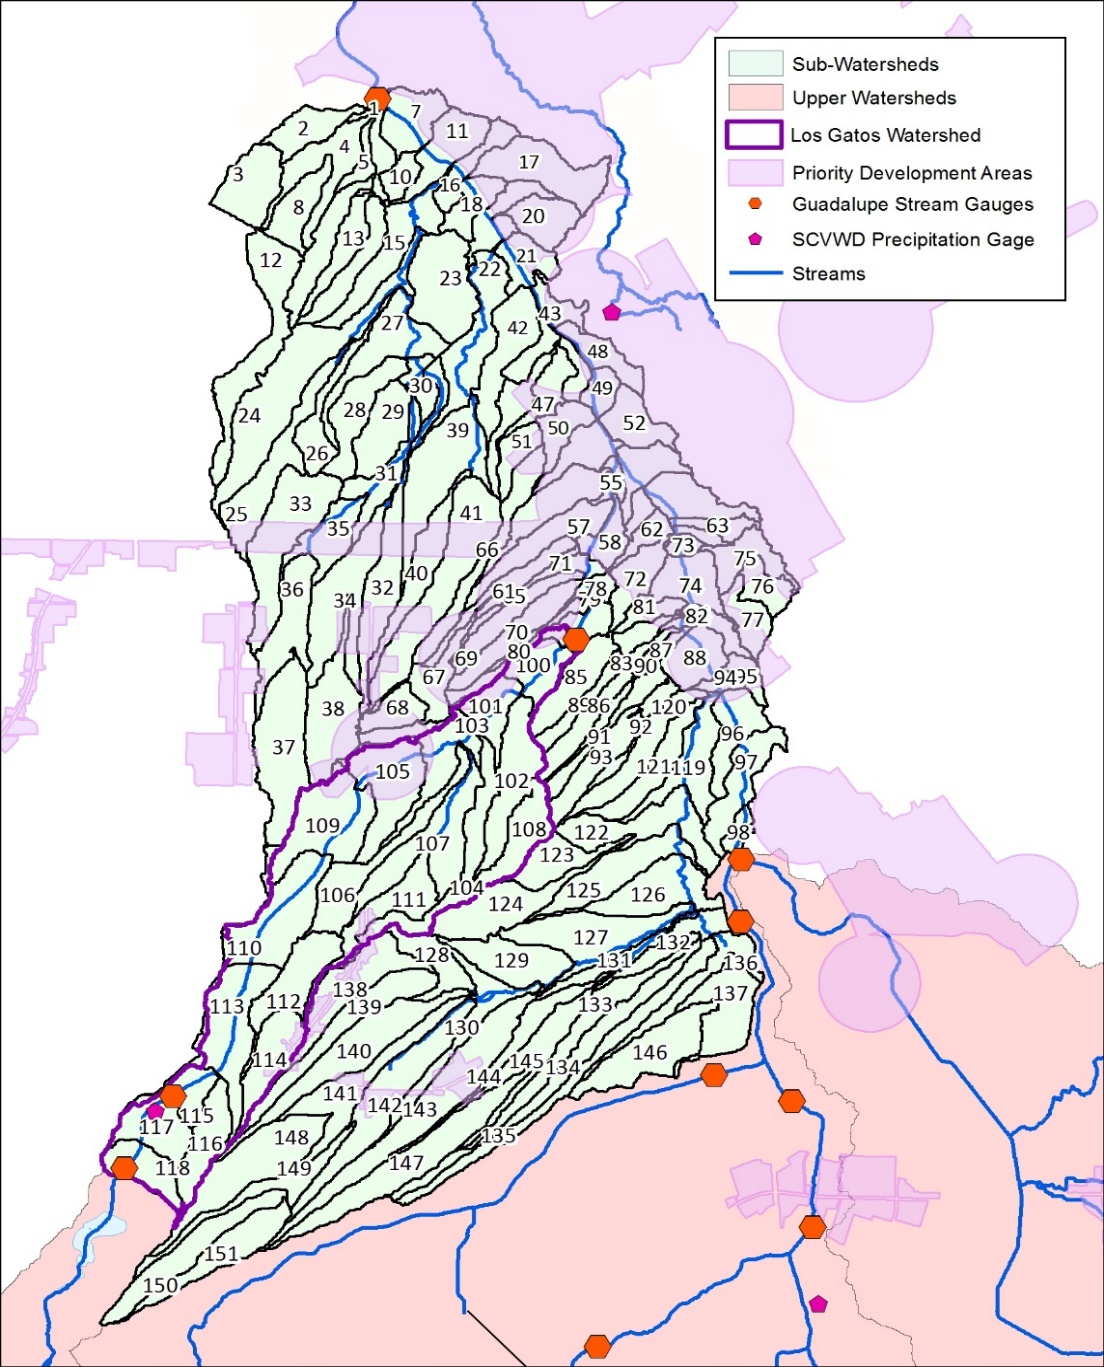
The first step in setting up the Modeling Tool is to delineate the watershed into smaller, sub-basins (model segments) using topographical data; the model treats each sub-basin as a homogeneous unit. Through a terrain analysis ArcGIS extension called TauDEM, the Lower Guadalupe River watershed was delineated into 150 sub-watersheds, ranging from 11 to 381 acres (Figure 3-7). Model setup also involves land use reclassification, reformatting input data into SWMM5 model formats, assigning the model segments to proper rain gauge, selecting assessment points, and estimating initial model parameters through GIS analysis and literature review. The time step of model simulation was set as 15 minutes, to be consistent with the resolution of precipitation. The model configuration established a representation of Lower Guadalupe River watershed, and model calibration was then followed to ensure the model parameters reasonably represent the watershed condition.
Figure 3-7 Delineated Lower Guadalupe River Watershed
3.6.3 Model Calibration
Model calibration is an iterative process of adjusting key model parameters to match model predictions with observed data for a given set of local conditions. Through the model calibration, it is hoped that the resulting model will accurately represent important aspects of the actual system. The model calibration is necessary to ensure that a representative baseline condition is established with a high degree of confidence in its applicability to form the basis for comparative assessment of various management scenarios.
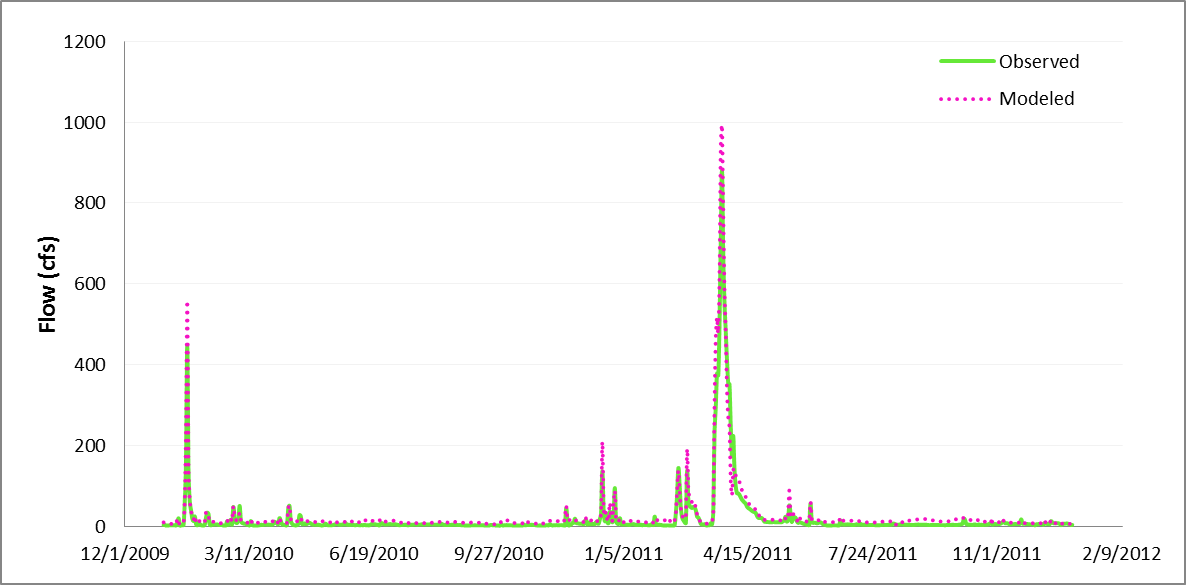
The hydrologic calibration was performed at two stations (Figure 3-6) within Lower Guadalupe River watershed by means of an iterative process of trial and error using logical adjustments of parameters in consultation with local experts and technical advisors. The calibration started at the tributary station SF50 (Los Gatos at Lincoln avenue) to ensure a reasonable estimates of flow from this tributary. After the calibration was completed at this station, the calibration was then performed at the USGS station at Highway 101, near the mouth of the Guadalupe River. The calibration period was from year 2010 to 2011.
- Baseflow
SWMM5 was originally designed to simulate urban wet weather runoff but does include a method of estimating base flow (dry weather flow) (Rassman, 2010). The baseflow for the Lower Guadalupe River was determined from the measured dry weather flow in 2010 and 2011. A constant flow of 5 cfs was added to two nodes in the tributary and produced an appropriate calibration for the USGS gage.
- Calibration Parameters
SWMM5 is associated with a large number of spatially variable parameters that describe the characteristics of individual subbasins. A subset of the model parameters associated with frequent storm events - impervious percentage, subcatchment width, Manning’s roughness, depression storage, and soil infiltration parameters, are sensitive and typically used as hydrologic calibration parameters. The calibration effort was focused on adjusting these parameters until modeled flow rates match the timing, magnitude, and total volume of the observed data.
The percentage of imperviousness turned out to be the most sensitive parameter, strongly influencing both the total volume of runoff and the peak flows. To obtain a good adjustment of the hydrograph, the initial percentage of imperviousness was decreased 10% for each subcatchment. The subcatchment width is an abstract basin parameter computed by dividing the subcatchment area by the travel length. Because of its inherent uncertainty, this parameter was also used as a major tuning parameter. The travel length was increased for all basins (ranging from 50% to 100%) to create a more attenuated response to storm events. These are reasonable adjustment when taking into account the error margin that can be obtained when estimating these parameters (Wickham, et al, 2013). The parameters of depression storage, infiltration and roughness are less impactful and were adjusted within the range of the established values in the literature to help further improve model calibration.
- Hydrologic Calibration Results
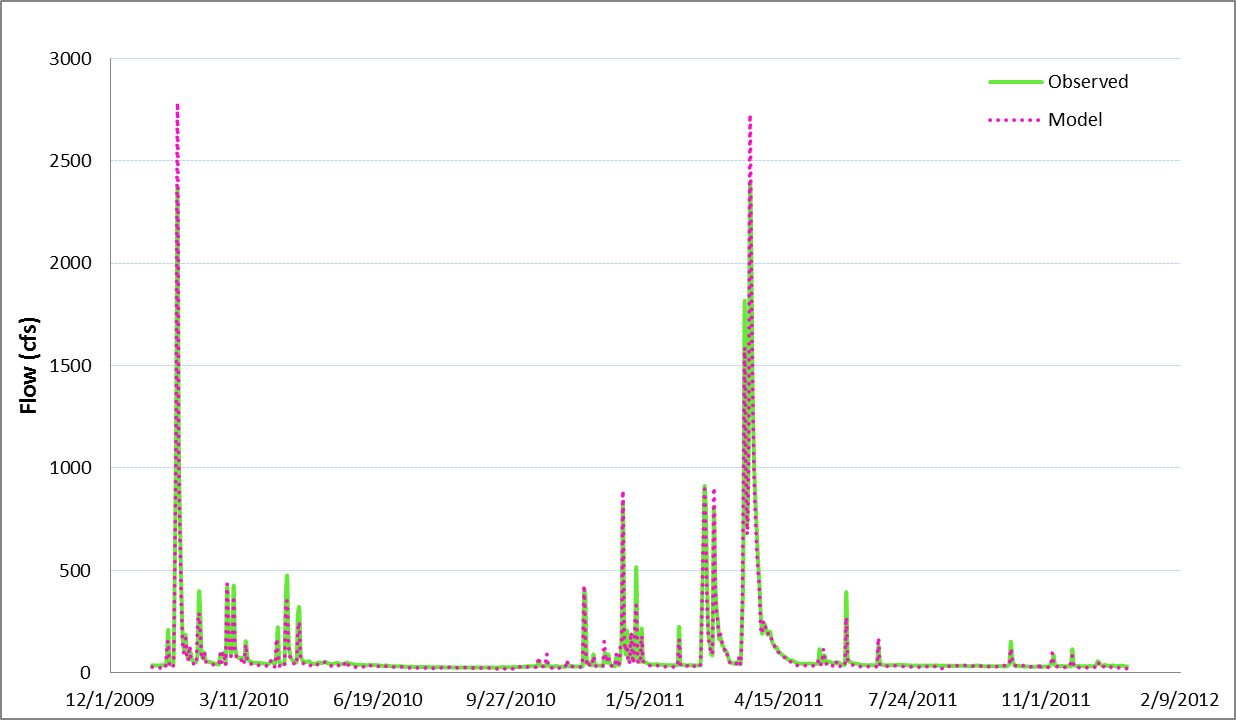
The results of the final calibration are provided in Figure 3-8 and Figure 3-9. At both stations, modeled daily flow match the volume and timing of observed data well, but the peaks of biggest storms were consistently over simulated. Several factors could contribute to this. The inflow from the upstream stations makes up the majority of flow in Guadalupe River and heavily impact the calibration at downstream stations (Figure 3-5). The high flow from these stations were extrapolated from flow-stage curves that often are not calibrated or updated with field measurements during the biggest storms due to lack of personnel and sometimes hazardous conditions (SCVWD, personal communication, 2014). As a result, these flow numbers may not be very reliable and could be biased high. The model uses precipitation data from three rain gages and assigns representative stations to sub-basins based on Thiessen polygon method (Figure 3-4). Localized rainfall events, typical in the Guadalupe watershed as characterized by large variation in mean annual precipitation ranging from 48 inches in the headwaters to 14 inches at the Central San Jose, may not be captured and could contribute to the discrepancy between modeled and observed peak flows. In addition, uncertainty in some key input data such as the percent of imperviousness, local soil conditions, and directly connected impervious area could also introduce uncertainty into the model calibration.
Figure 3-8. Modeled and observed daily flow at Los Gatos Creek, Lincoln Avenue
Figure 3-9. Modeled and observed daily flow at USGS station near highway 101
These caveats accepted, the accuracy of the model calibration was also quantified based on the calculated mean error for the modeled and observed storm volume and Nash–Sutcliffe model efficiency (Nash and Sutcliffe, 1970). Both statistics are well within acceptable criteria, indicating an overall good hydrologic calibration; a first indication that the model calibration is quite sufficient to support the GI application.
Table 3-6. Statistics for evaluation model calibration
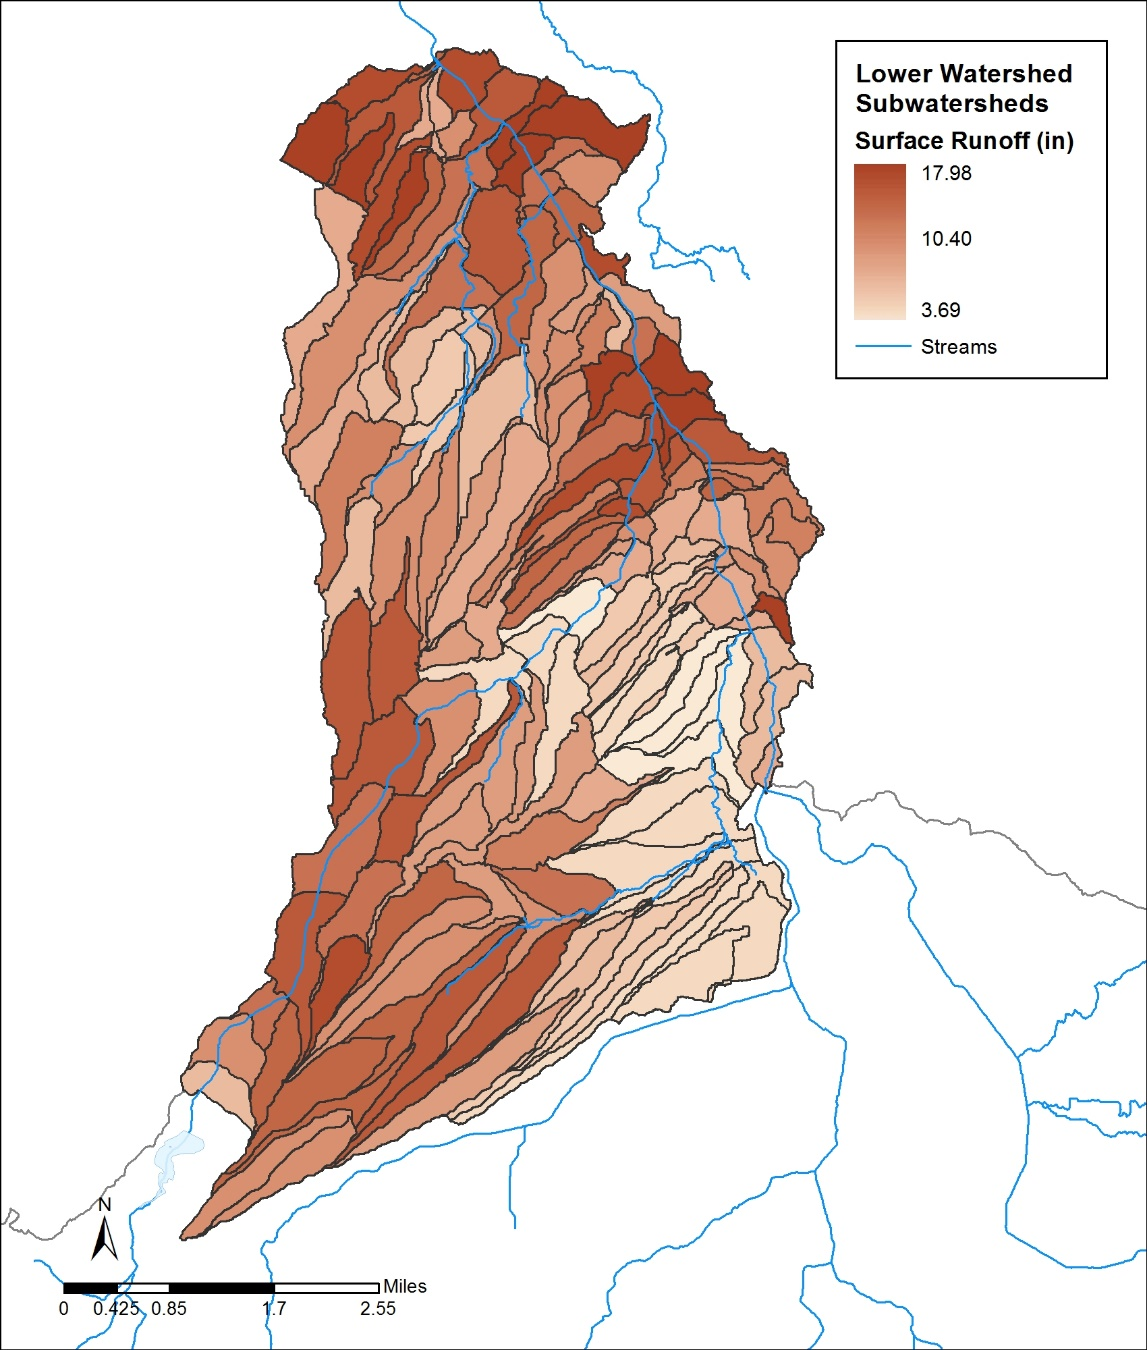
Figure 3-11. Surface Runoff Distribution for Baseline Condition
3.7 Optimization Tool
As the last tool in the Toolkit application, the Optimization Tool repeatedly runs the Modeling Tool to iteratively arrive at the optimized GI scenario. The objective of the Optimization Tool is to determine GI locations, types, and design configurations that minimize the total cost of management while satisfying water quality and quantity constraints. Currently, three GI feature types - bioretention, infiltration trench, and permeable pavement were built in the Tool, as recommended by the project Technical Advisory Committee (TAC). The major steps of this application includes formulating optimization problem, selecting critical storm, designing GI representation, and assigning GI cost.
3.7.1 Focus Area
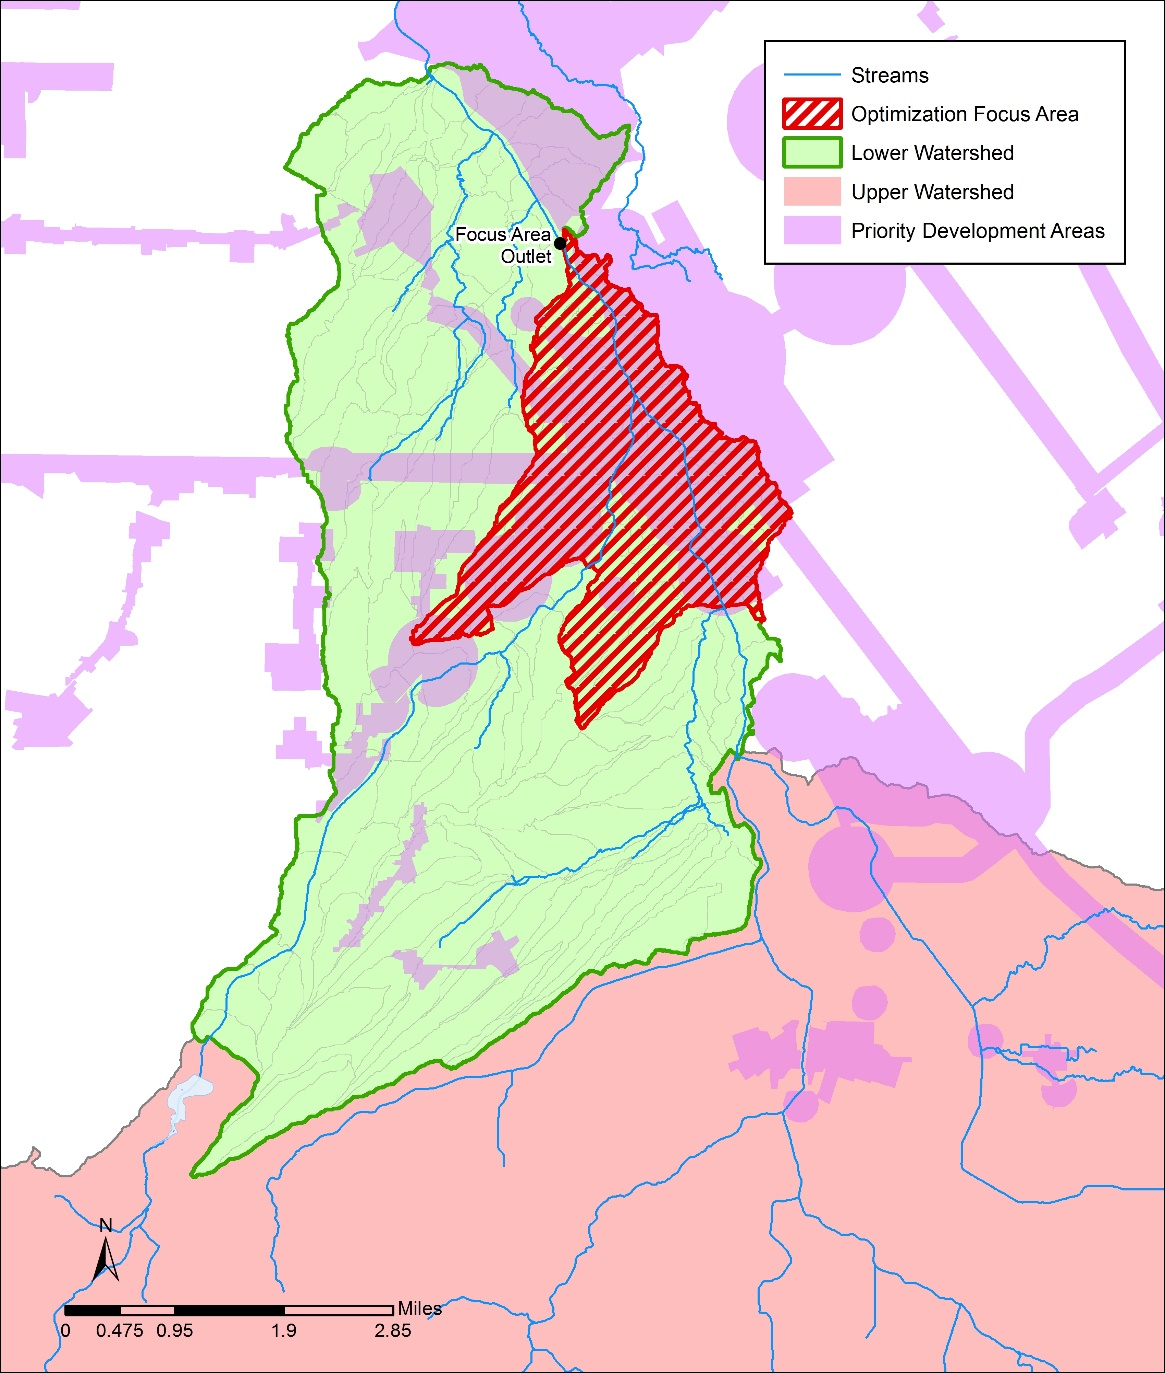
Downtown San Jose, a primary focus area for redevelopment, was selected from the Lower Guadalupe watershed to demonstrate the application of the Optimization Tool. The selected watershed covers 53 model segments with a total area of 4300 acres (Figure 3-12). The Optimization Tool was to identify cost-effective GI combinations and distributions for the selected area, for which future GI retrofit and implementation are planned to offset the impact of the new development.
Figure 3-12. Optimization Focus Area
3.7.2 Optimization Problem Formulation
The application of the Optimization Tool began with the formulation of optimization problem, which requires the determination of management targets and selection of assessment point and decision variables.
- Management targets
The determination of management targets is the first step in formulating an optimization problem. These management targets can be based on flow and/or water quality. For example, a management target for flow can be a desired reduction in average annual volume, peak discharge, or exceedance frequency. For this case study, no specific reduction targets were defined, and the overall management targets are to reduce total runoff volume for a design storm event. Therefore, a full range of control targets from 0 -100% were explored, and the optimization was to identify optimal solutions for any possible targets within the range.
- Assessment point
An assessment point is the location in the study basin where runoff or pollutant loading reduction will be evaluated relative to optimization goals. The assessment point for this study is the outlet of the study area (Figure 3-12).
- Decision variables
To run the optimization analysis, the user must define decision variables that will be used to explore the various possible GI configurations. For this analysis, the decision variables are defined as the number of fixed-size units of the distributed GI types. In the Lower Guadalupe San Jose case study, the total number of decision variables ended up as 159 (53 basins*3 GI types). For each applicable GI type, the decision variable values range from zero to a maximum number of potential sites, which were identified by the GIS Site Locator Tool. The decision variables were also constrained by the total area that can be treated by GI within each sub-basin. Through the discussion with the project Technical Advisory Committee (TAC), a 4% “rule of thumb” (defined as GI design at four-percent of the project area to capture 100% stormwater volume of a design storm) was used to size GI for this study. During the optimization process, the combined numbers of GI were forced to be less or equal to the maximum numbers calculated by applying this 4% rule.
3.7.3 Design Storm
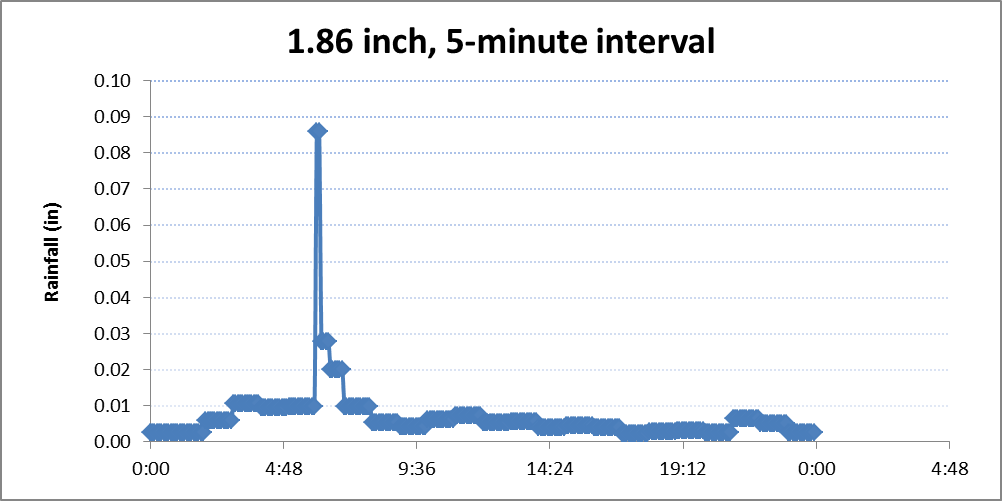
The setup of the Optimization Tool also required the selection of a typical precipitation year for use in comparing alternatives and assessing downstream impacts. At the recommendation of the City of San Jose, a 2-year storm with 24-hour duration was selected to drive the simulation process. The storm has a total rainfall of 1.86 inches, according to Santa Clara County’s drainage manual (Santa Clara County, 2007). The distribution of the storm was derived from a normalized rainfall pattern recommended by the manual for use in the San Jose area (Figure 3-13). To be consistent with the resolution of the storm event, the time step in the Modeling Tool as used by the optimization engine was also set at 5 minutes, different from the 15-minute time steps used in the model calibration.
Figure 3-13. Distribution of San Jose 2-year Storm Event with 24-hour Duration
3.7.4 GI Representation
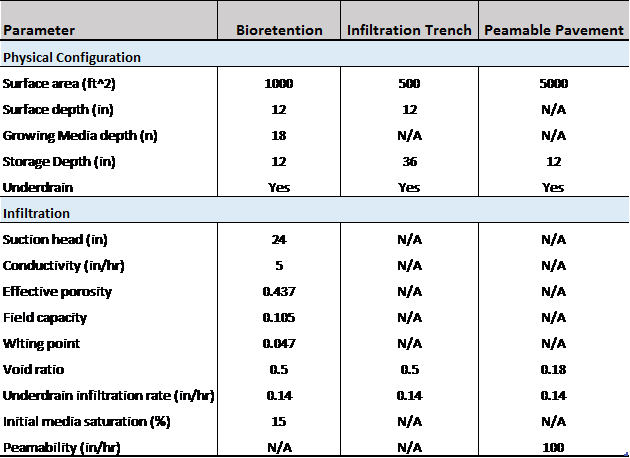
Three GI types - bioretention, infiltration trench, and permeable pavement were included for optimization. Each GI type was assigned a typical size and design configuration that remained unchanged during the optimization process. The decision variables were the number of each GI type within each sub-basin and changing in size of GIs was implicitly reflected through the change of number of GIs implemented. Table 3-5 summarizes key design parameters for each GI feature.
Table 3-6 GI configurations used in Optimization Tool
3.7.5 GI Cost
Local sources were used to derive capital cost data for GI on public rights of way. The reliable cost information for each GI feature is critical for identifying optimal solutions, because the optimization process and solutions are highly sensitive to the cost function. A unit cost approach was used to calculate the total cost associated with each GI scenario formed in the optimization process, in which cost per square feet of surface area was specified for each GI type and the total cost of any GI scenario was calculated as:
Total cost = ? (number of each LID type * unit cost * surface area of each LID type)
Implementing GI at the landscape scale would incur many costs ranging from traffic control, construction, to maintenance and operation. For this project, the costs considered were construction, design and engineering, and maintenance and operation (with 20 year lifecycle).
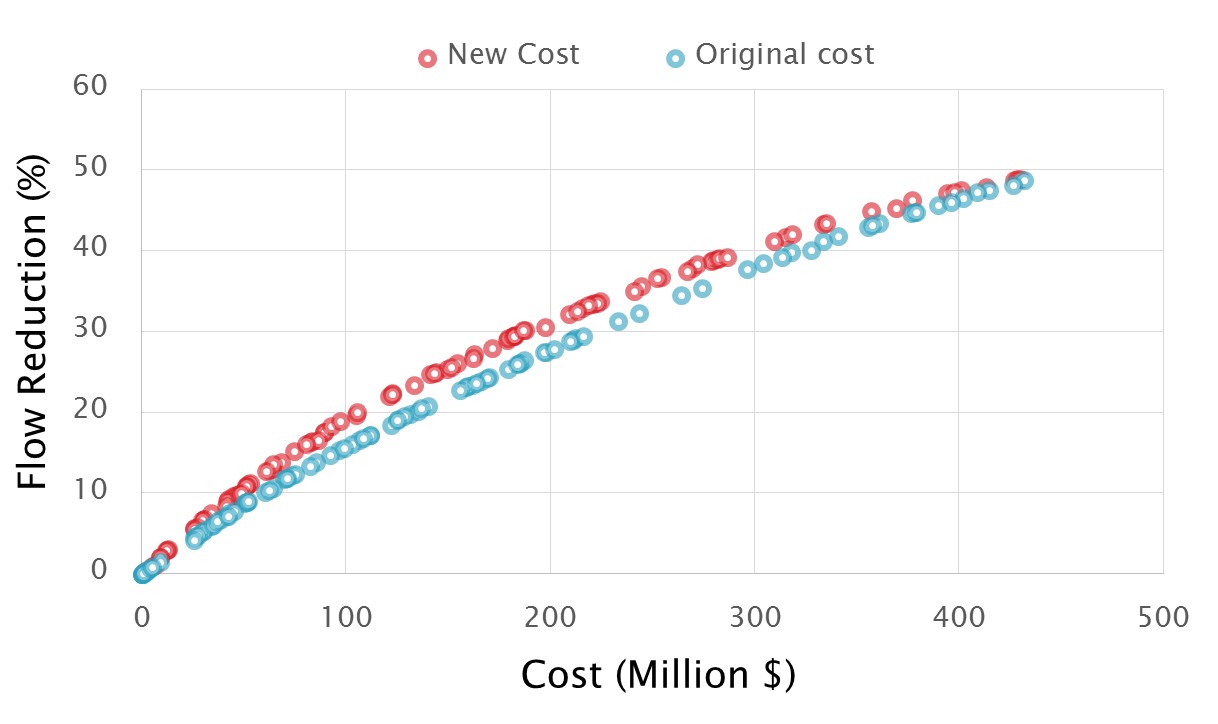
GI cost information for various GI types were collected from literature review, contacting local stormwater agencies, as well as reviewing similar studies in other regions. In general, only limited cost information was available, and these costs vary greatly from site to site due to varying characteristics, different design/configuration, and other local conditions/constrains (Table 3-7). After consulting with the TAC and stakeholders, the cost for bioretention was estimated as $104/square foot (sf) surface area, infiltration trench as $90/sf surface area, and permeable pavement $34/ sf surface area. These cost estimates were used to form the cost function in the Optimization Tool, which were evaluated through the optimization process at each iteration.
Table 3-7 GI unit costs from different sources

3.7.6 Optimization Results
Consistent with Site Locator Tool analysis, two scenarios were run with the Optimization Tool: with base analysis and without base analysis. With each scenario, the optimization procedure was run for 200 iterations, each with 100 solutions. After which, the optimization converged to final optimal solutions and the process was stopped. The entire process took about 2 hours of computer time from start to finish – a run time deemed reasonable by the TAC; a good tradeoff between spatial resolution and model usability.
- Cost-effectiveness curve
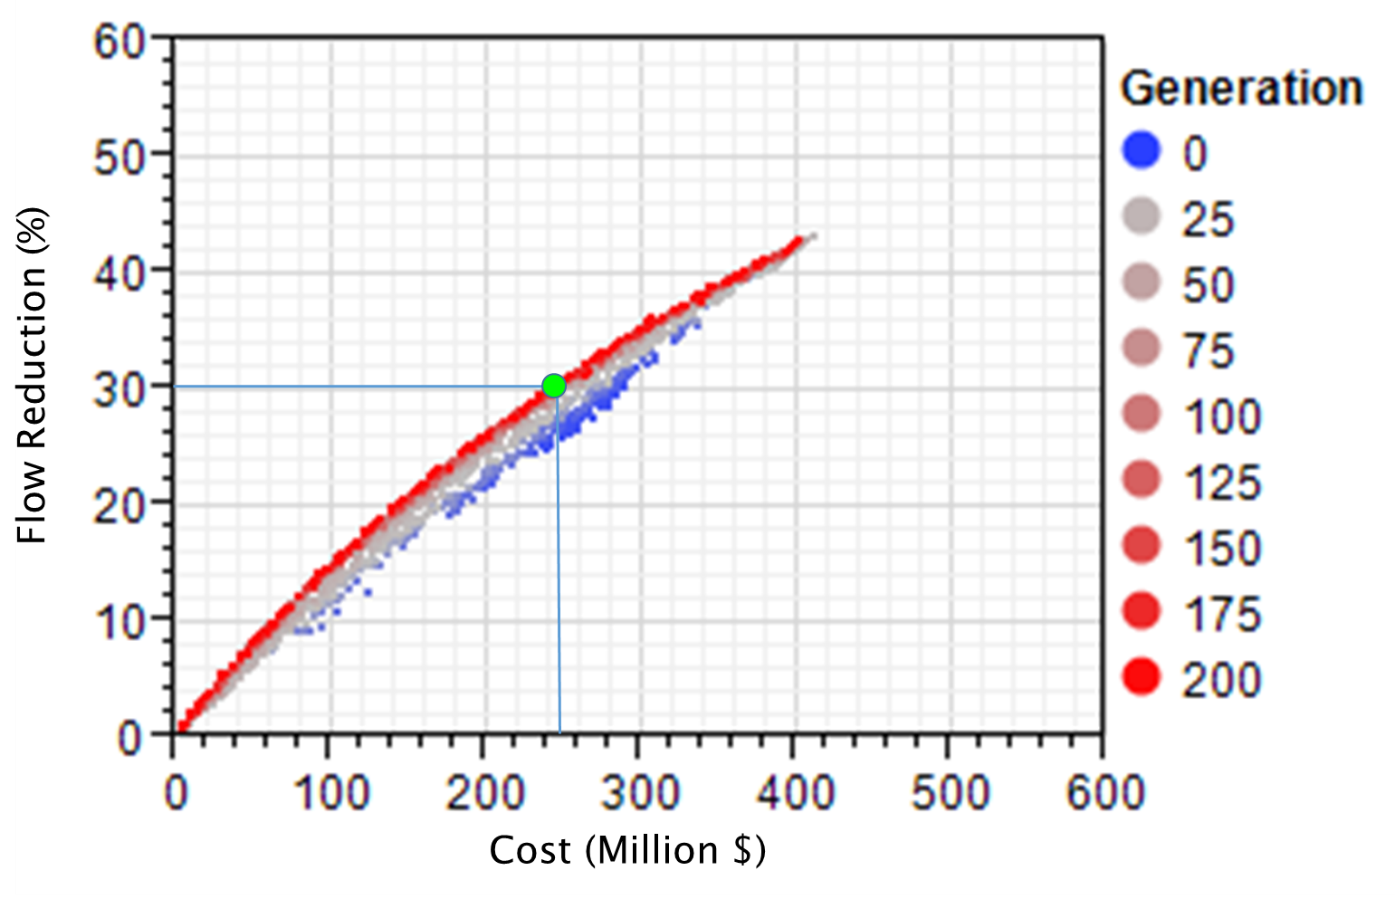
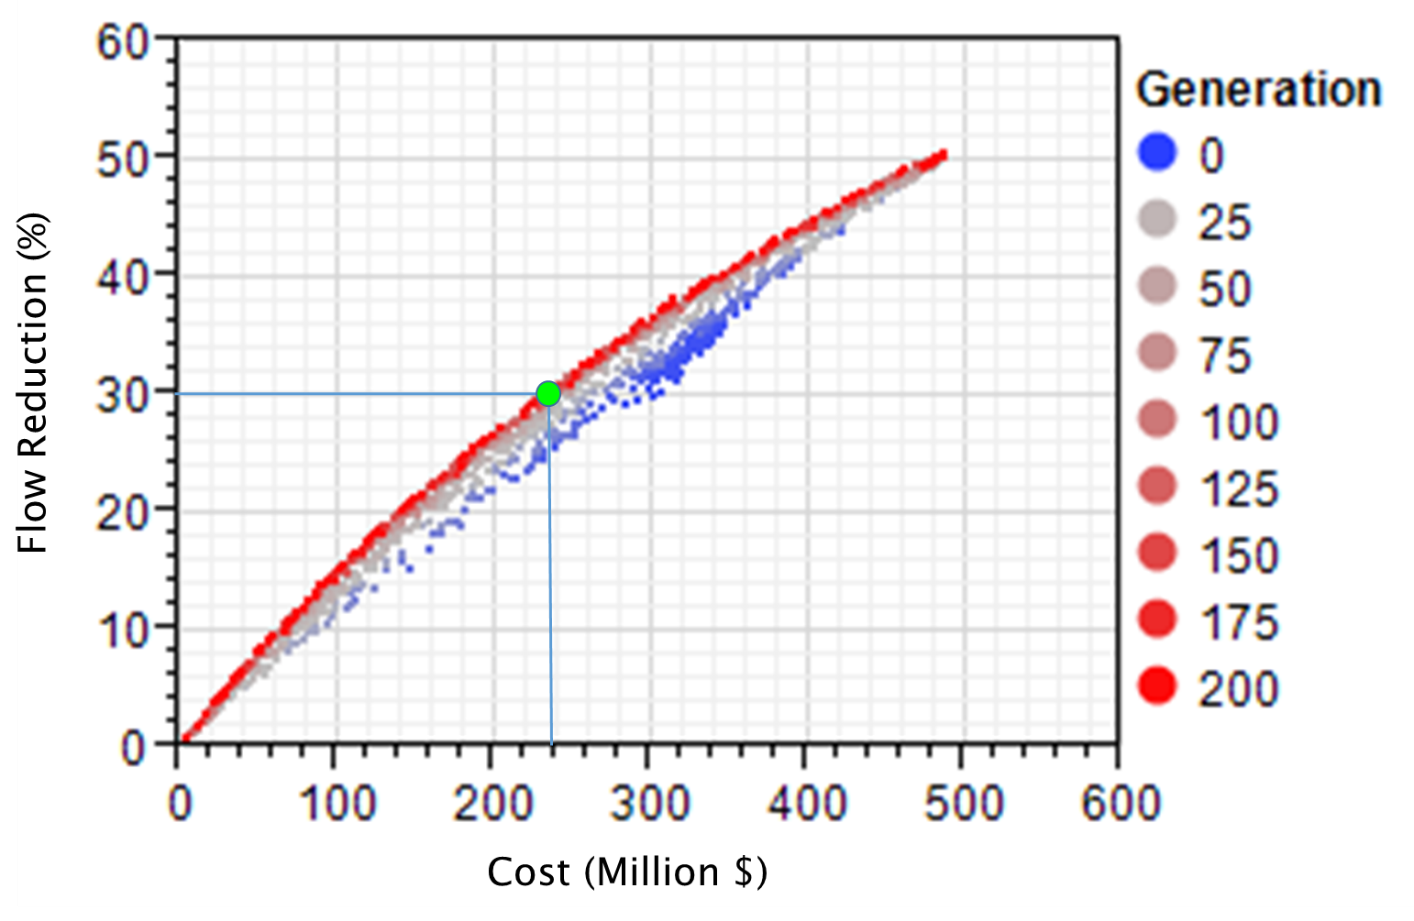
The optimization process outputs the optimal solutions along a cost-effectiveness curve. The curve relates the levels of runoff removal efficiency to various combinations of GI throughout the watershed and their associated cost. Figure 3-14 and Figure 3-15 show the cost-effectiveness curve for scenario with/without base analysis, respectively. For each scenario, all 20,000 individual solutions are plotted together, with the optimum solutions that form the left- and upper-most boundaries of the search domain highlighted in red. Each point on the graph represents one combination of the number of bioretention units, Infiltration Trench, and permeable pavement for each subarea within the study area.
Figure 3-14. Cost-Effectiveness Curve for Scenario with Base Analysis
Figure 3-15. Cost-Effectiveness Curve for Scenario without Base Analysis
The cost-effectiveness curve suggests that there exists a largely linear relationship between level of implementation (represented as total cost) and runoff volume reduction, and the maximum achievable runoff volume reduction at the outlet of study area, given the objectives and constraints associated with the study, is approximately 43 percent for with base analysis (Figure 3-13) and 50 percent for without base analysis (Figure 3-14). With the help of this information, decision makers can set realistic goals on how much can be achieved and the level of investment required, as well as determine at what point further investment on GI will yield no improvement on runoff reduction. Between the two scenarios, more GIs (and thus higher cost) will be required for the with base analysis to achieve the same level of runoff reduction (i.e. 30% reduction), as the base analysis excluded some potential sites for more efficient GI types bioretention and infiltration trench, and the optimization was forced to pick more of less efficient types (incurring more cost) to make up the difference. While the cost distribution does not provide specific information about the spatial locations of actual GI features nor the actual cost of build out, knowing the types of practices associated with each point along the cost-effectiveness curve provides insight into the reasoning and order of selecting individual practices.
Of the two scenarios, the City is primarily interested in the scenario without base analysis. Therefore, the discussion of optimization results from here on was focused on this one only.
- Example scenario – 30% reduction
The optimal combinations of GI types and numbers for user-defined reduction goals along the cost-effective curve can be specified. Take the example of a 30% runoff reduction goal, the optimal combination of GI types identified through the optimization process is listed in table 3-8. In total, 3300 GIs will be needed to treat the 4300 acre focus area with a price tag of $240 million based on the model assumptions of GI design and unit cost. The number of each GI type needed for achieving certain reduction goal is generally determined by the collective factors of GI design, cost and potential feasible locations. The actual cost would be much less than the $220 M price tag given the opportunity to reduce unit costs through standardized designs batched implementation, implementation with other road related or drainage related projects, public-private partnerships, reduced need to upsize existing grey infrastructure, and many other benefits not accounted for such as increased property values, reduced heat and other benefits.
Table 3-8 The Number of GI identified for 30% Runoff Reduction
Figure 3-18 Optimal Permeable Pavement Sites for 30% Runoff Reduction
It is important to emphasize that users must interpret the optimization results in the context of specific problem formulation, assumptions, constrains, and optimization goals unique to this case study. If one or more assumptions are changed, for example, the optimization target was designed as reducing peak flow instead of total volume, the optimization might have resulted in a completely different set of solutions in terms of GI selection, distribution, and cost. It also should be noted that because of the large variation and uncertainty associated with unit GI cost information, the total cost associated with various reduction goals calculated form the unit cost do not necessarily represent the true cost of an optimum solution for the basin evaluated and are not transferable to other basins. Rather, these cost should be interpreted as a common basis to evaluate and compare the relative performance of different GI scenarios. The Optimization Tool provides a framework to identify optimal solutions for addressing stormwater management issues at the watershed level.
- Comparison with Results from Site Locator Tool
For the study area, the preliminary GIS screening through the Site Locator Tool identified 23,600 potential sites for GI implementation. These sites could serve as a starting point for GI planning and form the basis for the application of the Optimization Tool. Through the optimization process, not only were the number of sites reduced down to 3300, but the optimal combinations of GI were also identified. (Figure 3 -16). More importantly, the use of the Optimization Tool can provide users with critically needed quantification on cost and benefit (reduction) associated with various management options to help them in finding informed and optimal solutions. Therefore, the application of the full Toolkit is always preferred when sufficient data are available to support the development of the Modeling and Optimization Tools.
3.7.7 Sensitivity Analysis
Previous studies (USEPA 2011, State of Washington 2013) suggested that the optimal process and solutions are highly sensitive to GI cost. A sensitivity test was run to test sensitivity of optimal solutions to GI unit cost estimates. The unit cost for each GI type was changed (Table 3-9), and the optimization procedure was similarly run for 200 iterations with a population size of 100.
Table 3-9 GI unit cost for sensitivity analysis

As expected, the sensitivity results suggest that assumptions made with GI cost were highly influential on the optimization modeling results. Varying the unit cost, at the same level of reduction results in different price tags and GI combinations or vice versa (Figure 3-19). For instance, at the 30% runoff reduction level, the total price tag will be $220 million with the original unit cost, but $200 million with the new cost. And the optimal combinations of GI types and numbers are also different. Therefore, reliable and accurate local cost information should be used to drive the optimization process, wherever possible.
Figure 3-19. Optimal Fronts of Sensitivity Tests
Discussion and Recommendations
Chapter 4
The GreenPlan-IT Toolkit is a planning level tool that provides users with the ability to evaluate the cost effectiveness of GI for addressing stormwater management in urban watersheds. The case study in City of San Mateo demonstrated how the GIS Site Locator tool was used to screen potential sites for GI implementation, while case study in San Jose PDA highlighted the power and utility of the Toolkit and demonstrated how to use the Toolkit to support a cost-benefit evaluation of stormwater runoff control. The two case studies provide useful and practical information that can help managers to understand and evaluate the benefits of GI in urban watersheds.
As illustrated by the San Jose case study, the application of the Toolkit requires careful formulation of the management questions and the optimization objectives. Setting up the Modeling Tool requires deciding on the appropriate spatial scale such as the number of sub-catchments and resolution used to represent GI, as well as the input data collection, model calibration, and development of the baseline condition. The Optimization Tool can be very powerful when combined with hydrologic modeling and cost analysis. Successful and meaningful application of the Optimization Tool largely depends on accurate representation of the watershed baseline condition, GI configurations, and the associated GI costs. The sensitivity analysis demonstrated that the optimization process is highly sensitive to GI cost data used in selecting solutions, and as a result, sensitivity analysis and evaluation of cost control measures or economies of scale are recommended wherever the Toolkit is applied. This section discusses the lessons learned from these case studies, identifies major data gaps, and makes recommendation on future enhancements.
4.1 Lessons learned
The case studies presented in this report provide useful and practical guidance for conducting similar studies in other watersheds. The lessons learned from these case studies could benefit potential GreenPlan-IT users.
- Determination of Spatial Scale
The first challenge in any modeling study is to determine how detailed the model needs to be in order to properly represent the system. The model should only be as complex as necessary to address modeling objectives and answer the management questions. In the context of optimization for GI placement, the study area should be delineated into sub-basins that are small enough to be meaningful for guiding GI implementation while not adding extra burden on model run time. There will always be a trade-off between model spatial resolution and run time. Different choices might be made by first time users versus seasoned users.
- Importance of Model Calibration
The model baseline is the foundation upon which all subsequent analyses depend and is crucial for meaningful results. The importance of a representative baseline model highlights the importance of model calibration. In the San Jose case study, a significant amount of effort was invested to calibrate SWMM using a weight-of-evidence approach to ensure the baseline model adequately represents the existing watershed conditions. Future users of the Toolkit should always bear this in mind and invest effort in model calibration with local data to ensure the meaningful application of the Toolkit.
- Interpretation of Optimization Results
The Optimization Tool performs iterative searches to identify cost-effective solutions. The search process is dependent on the problem formulation, model assumptions, GI cost and GI treatment effectiveness. Therefore, the cost-effective solutions from the optimization process would very much depend on the user-defined goals and assumptions and must be interpreted within the context that defines each specific application. The application of GreenPlan-IT Toolkit must also be accompanied by an intimate understanding of the study area and all influential factors that affect local stormwater management in order to ensure meaningful interpretation of optimization outcomes.
- Consideration of Optimization Run-time
The total number of iterative runs needed for the optimization process to converge to the optimal solutions is dependent on the number of decision variables, model simulation period, and the complexity of the model (number of sub-basins and stream neatwork). More model runs usually leads to longer computation time. For the San Jose case study, it took about two hours for the optimization process to reach optimal solutions after 200 runs, and this short computation time is largely benefited from a very short simulation period (24 hours). If the Optimization Tool is applied to a large watershed with many feasible GI sites and a complex stream network and the optimization process is based on long-term continuous simulation, a large amount of computation time will be needed to reach the optimal solutions. In general, the computational efficiency can be achieved through reducing the number of decision variables, simulation time, and complexity of the problem.
4.2 Data Gaps
The GreenPlan-IT Toolkit is a data-driven tool whose performance is dependent on the availability and quality of the data that support it. Through the two case studies, major data gaps for each tool were identified.
- GIS data
The placement opportunities for GI define the extent to which GI can beneficially impact flow volume. In each of the case study, limitations were placed on the locations available for GI placement, which in turn led to a definition of the maximum potential effectiveness of the GI in controlling runoff volume. Some of these limitations were physical constraints of the landscape that were derived during the engineering and design process. Other limitations were defined based on land use or ownership criteria resulting from the local decision making process. The restrictions placed on GI must be understood in order to evaluate the management scenarios.
- Monitoring data
Developing the Modeling Tool to establish a representative baseline requires the calibration of the model with monitoring data. For the San Jose case study, there were good precipitation time series, long-term flow monitoring data at a number of gages, and good spatial data to characterize land use and impervious cover to support model development. While in the San Mateo case study, lack of monitoring data limited the full utilization of the Toolkit. Lack of monitoring data, in particular water quality data, and general quality issues associated with model input data will be a major hurdle when applying the Toolkit to other watersheds in the Bay Area.
- GI cost information
As demonstrated by the sensitivity analysis of the San Jose case study, the optimization strongly depended on the available GI cost information, and uncertainties in local cost data can greatly influence the management conclusions. GI cost could vary widely from one location to another, influenced by site-specific factors such as physical characteristics, constrains, and local economy. For the San Jose case study, there was very limited information available on GI cost, most of which was for bioretention and little for infiltration trench or permeable pavement. The understanding and utilization of the optimization results must take this limitation into account. To ensure a meaningful application of the Toolkit, reliable local cost information must be collected to drive the optimization process. While it is important to have accurate cost information for each GI type, it is the relative cost difference between GI types that determines what constitutes the optimal GI types and combinations. Therefore, it is crucial to have reliable estimates on relative cost difference between various GI types and interpret the price tags associated with each GI scenario as the relative merits of one scenario verse another, not as the true cost of implementation.
4.3 Future Steps/Enhancements
The case studies showcased in this report were focused on stormwater volume control and represent the first phase of the GreenPlan-IT Toolkit development. To develop a tool that is comprehensive and flexible enough to handle a variety of situations and address a wide range of management questions, the Toolkit needs to be continuously evolving. Future enhancements on the Toolkit are identified through experiences and insights gained from the Toolkit development, case studies, and discussion with the TAC and stakeholders.
- Site Locator Tool
During the next development stage, more GI types could be included in order to develop a wide range of management alternatives. In addition to new GI types, some cities may also be interested in keeping centralized regional facilities such as enlarged bioretention as an option to supplement GI implementation. A diverse set of management options should be evaluated through the Toolkit to provide solutions to a wide range of stormwater management problems. Such additional features could then be considered within the modeling and optimization tool components thus keeping the tool flexible enough to address multiple endpoints such as drinking water supply augmentation or storm sewer master planning. Furthermore, changes to the Site Locator Tool’s Opportunities and Constraints ranking functionality would allow for final ranked locations to contain information showing the reasons it was ranked high or low. Additional work could be done to allow for final outputs to be exported automatically to PDF formats as well as improving current KMZ/ Google Earth format functionality. Moreover, guidance and/or models could be developed to help municipalities create potential location layers needed in the Location Analysis of the Site Locator Tool.
- Water quality simulation/optimization
Currently, SWMM5 lacks mechanisms to simulate water quality reduction through GI implementation. This deficit is the reason why water quality simulation/optimization was not performed for the San Jose case study. Developing methodology and corresponding modules to quantify the pollutant removal efficacy for various GI types will be the first major task for future enhancements. EPA’s SUSTAIN modeling system includes a BMP module that uses a first-order decay approach to estimate the GI performance on pollutant removal. Incorporating this first-order method or use the module directly can be one way to tackle the water quality problems.
- Flexibility in Optimization Tool
The current setup of the Optimization Tool is tailored to the setting of the San Jose case study to expedite the tool development. Many important decision variables such as the total number of iterative runs and the size of the population were predetermined and coded in the tool programs. Next phase of the tool development should make key decision variables of an optimization problem as user-defined inputs to provide flexibility for broad applicability. Having users define these variables will also help them better understand how the tool functions.
- Improved cost function.
A major weakness in the current cost information is associated with cost data being derived from pilot scale one-off implementations. Future improvements of the cost function could include reasonable project batching scales (3- and 4-way intersections redevelopments that include multiple GI features, blocks or multi-block scale redevelopments, neighborhood scale redevelopments, and combinations of GI feature types (e.g. perviois pavement in concert with small and large bioretention)).
- Additional case studies of different settings
The Toolkit was applied to two case studies to demonstrate its power and utility. Additional applications of the Toolkit at other watershed settings will not only provide much needed insights on what the region needs, but also in the process will help improve/refine the Toolkit functionalities to meet these needs.
References
Chapter 5
Deb, K., Pratap, A., Agarwal, S., and Meyarivan, T. (2002). A fast and elitist multiobjective genetic algorithm: NSGA-II, IEEE Transactions on Evolutionary Computation, 6(2) (2002) 182-197.
McKee, L., Leatherbarrow, J., Pearce, S., and Davis, J. (2003). A review of urban runoff processes in the Bay Area: Existing knowledge, conceptual models, and monitoring recommendations. A report prepared for the Sources, Pathways and Loading Workgroup of the Regional Monitoring Program for Trace Substances. SFEI Contribution 66. San Francisco Estuary Institute, Oakland, Ca.
Nash, J.E., and Sutcliffe, J.V. (1970). River flow forecasting through conceptual models part I—A discussion of principles. Journal of Hydrology 10(3):282–290.
Rossman, L. A (2010). Storm Water Management Model User’s Manual, Version 5.0, U.S. Environmental Protection Agency. Office of Research and Development. EPA/600/R-05/040.
Santa Clara County, California, Drainage Manual. Adopted August 14, 2007
State of Washington (2013). Case study for applying SUSTAIN to a small watershed in the Puget Lowland. Department of Ecology Publication No. 13-03-009.
USEPA (2009). SUSTAIN - A Framework for Placement of Best ManagementPractices in Urban Watersheds to Protect Water Quality, EPA/600/R-09/095.
USEPA (2011). Report on Enhanced Framework (SUSTAIN) and Field Applications for Placement of BMPs in Urban Watersheds, EPA 600/R-11/144. U.S. Environmental Protection Agency, Office of Research and Development, Cincinnati, OH.
Wickham , J., Stehman, S., Gass, L., Dewitz, J., Fry, J. and Wade, T. (2013). Accuracy assessment of NLCD 2006 land cover and impervious surface. Remote Sensing of Environment, 130, 294-304.
