Chapter 1
Water quality in the San Francisco Bay and its watersheds is impaired by PCBs, mercury, pesticides and a number of other pollutants associated with stormwater runoff. Reducing stormwater runoff and contaminant loads is complex and relies on costly engineering, especially in highly-developed urban environments. Increasingly, distributed management of stormwater runoff using Green infrastructure (GI) is emerging as a multi-benefit solution that can address both stormwater quality and quantity concerns. Consistent with this trend, and under anticipated new stormwater permit provisions due in 2015, Bay Area local governments will be required to develop and implement watershed-scale green infrastructure plans to achieve quantitative water quality improvements.
A major barrier to regional-scale, widespread implementation of GI is a lack of watershed-based planning regarding where opportunity sites exist for GI retrofits and what constitutes the most cost-effective, achievable, and practical management strategy for achieving water quality targets for local landscapes. Realizing the need for a planning tool to support Bay Area municipalities to strategically plan and implement GI projects at a watershed scale, the State Board funded a research project[1] to develop a Toolkit that meets technical and institutional requirements for successful selection and implementation of GI projects. The resulting Toolkit was branded “GreenPlan-IT”. The Toolkit package, consisting of the software, companion user manuals, and this demonstration report, is available on the GreenPlan-IT Web site hosted by SFEI (http://greenplanit.sfei.org/).
This report describes the rationale for developing the GreenPlan-IT Toolkit; explains the Toolkit’s design and structure; and demonstrates the Toolkit’s capabilities through two case studies. Where appropriate, this report also examines the limitations of the Toolkit and provides recommendations for future enhancements. The additional input data/outputs for the Toolkit are also included in the appendices.
1.1 Project Rationale
Surface water degradation resulting from stormwater runoff has been an issue of primary focus for many Bay Area agencies. Despite the recognized effectiveness of GI in protecting water quality and reducing flood risk, and the mandatory implementation of GI under limited circumstances under the current NPDES Stormwater Municipal Regional Permit (MRP), the Bay Area’s implementation of GI continues slowly. To date, GI projects are largely placed opportunistically (e.g., where land becomes available), or as demonstration projects, at different points throughout a drainage area, with unknown and likely suboptimal flow and load reduction effectiveness. Little is known about the cumulative effects of implementing hundreds or even thousands of GI projects in Bay Area watersheds, either alone or in well-planned combination with “grey infrastructure” approaches. In addition, future MRPs will likely require local agencies to implement GI to achieve set goals at the watershed scale. Bay Area agencies need a scientifically sound planning tool to help develop quantitatively-derived watershed master plans to guide future GI implementation for improving water quality in the San Francisco Bay and its tributary watersheds.
GreenPlan-IT was developed to meet this critical need. The Toolkit can facilitate identification, evaluation and ranking of potential sites based on their relative feasibility and potential effectiveness in reducing stormwater runoff and pollutant loads. GreenPlan-IT can help Bay Area municipalities to address the following key stormwater management questions:
- Where are the suitable locations for GI implementation within the built-out urban environment?
- Where are the effective locations for GI implementation that could have the greatest potential leverage or effectiveness for reducing peak flow runoff and contaminant loads?
- What quantitative water quality and hydrological improvements can be made with GI approaches?
- What are the most cost-effective GI combinations for achieving certain reduction targets?
GreenPlan-IT combines a GIS screening tool, a publically available modeling platform, and an Optimization Tool to provide users with the ability to evaluate multiple stormwater management alternatives to support their decision making for addressing a variety of issues. The Toolkit can be used to comply with NPDES stormwater permit requirements including the development of an alternative compliance program, as well as addressing loads reduction needs identified in TMDLs. The Toolkit is intended for knowledgeable users familiar with GI and the technical aspects of watershed modeling, and applicable to predominantly urban watersheds. Although designed as a tool for Bay Area stormwater agencies, the tool has broad applicability and could be used by other regions as well.
1.2 Overview of GreenPlan-IT Toolkit
The GreenPlan-IT Toolkit is designed to support the cost-effective selection and placement of GI in urban watersheds through GIS analysis, hydrologic modeling and optimization techniques. The Toolkit consists of three components: GIS Site Locator Tool, Modeling Tool, and Optimization Tool. To provide flexibility for the user community and for future updates, the three components were designed as standalone modules and their interaction is either through data exchange, or as a submodule linked to another tool component. Figure 1-1 shows a generalized schematic of the Toolkit. Each tool in the Toolkit performs specific functions and is typically applied in sequence.
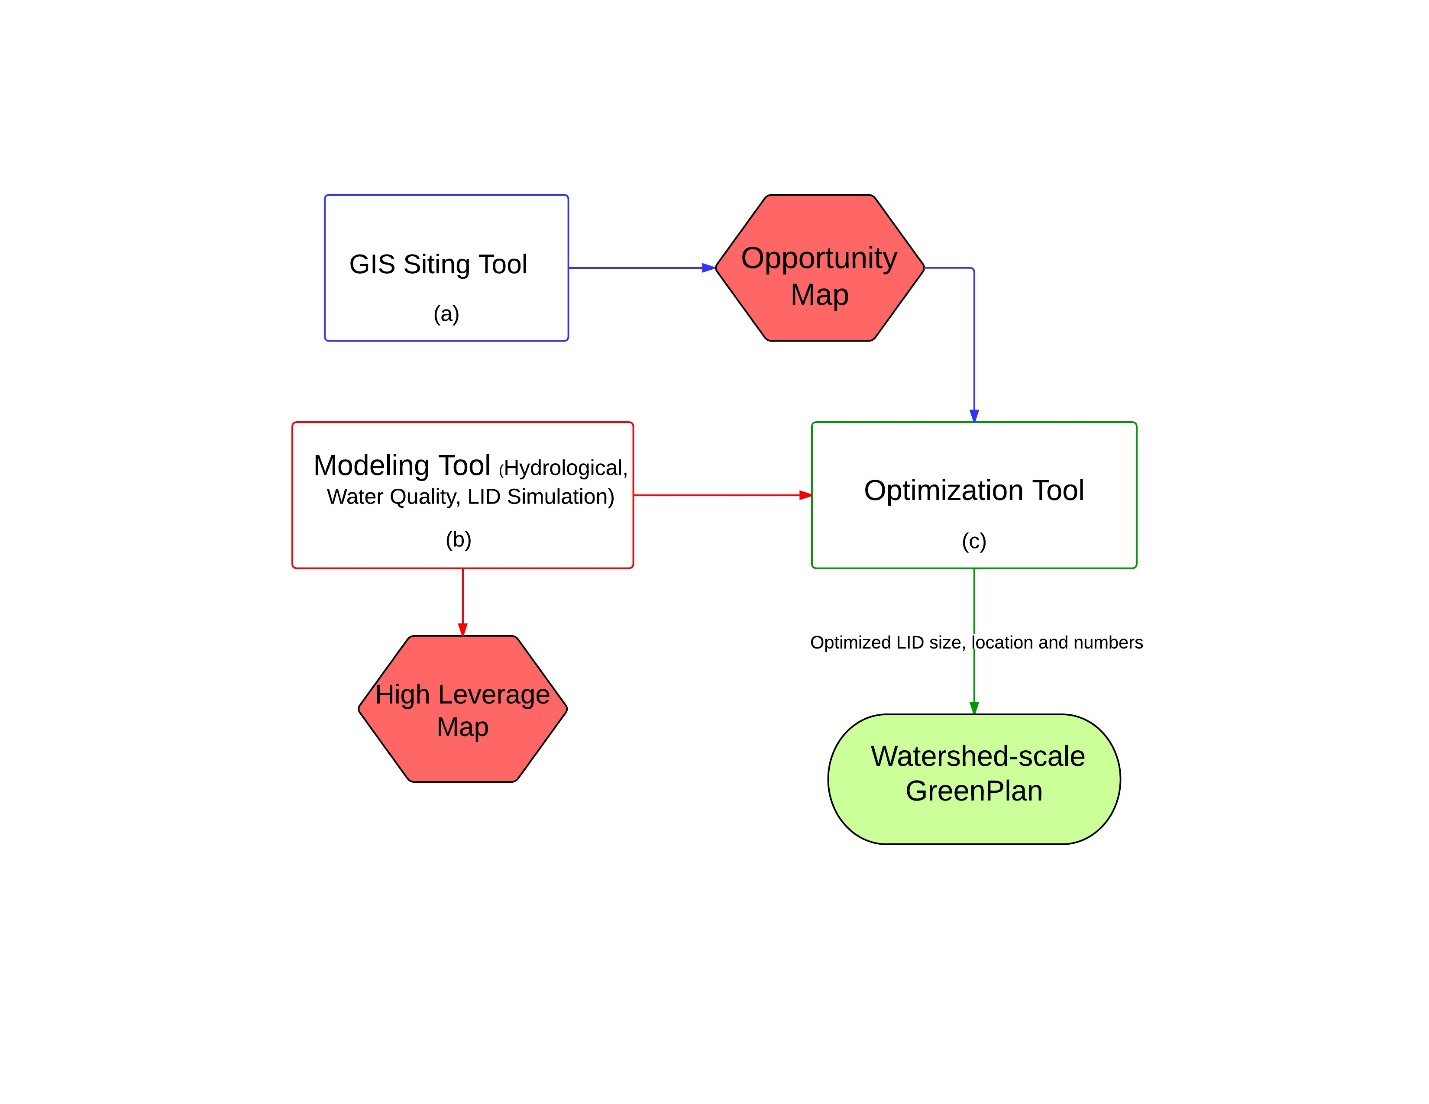
Figure 1-1. Schematic of GreenPlan-IT Toolkit
GIS Site Locator Tool
The GIS based Site Locator Tool is a screening tool that can be used to identify and rank potential GI locations through GIS analysis. The Tool incorporates many regional, publicly available data layers and builds in five intersecting analyses that require user input data to produce maps of possible GI locations. These analyses are optional, providing end-user flexibility to add local data layers to best identify suitable locations and rankings of GI locations, to produce outputs of different levels of refinement, and to run the analyses with varying levels of data availability. The Site Locator Tool can be fine-tuned iteratively as additional local data or data with better resolution become available.
There are five optional analyses within the Site Locator Tool: the Regional Base Analysis (RBA), Locations Analysis, Opportunities and Constraints Analysis, Ownership Analysis, and Knockout Analysis (Figure 1-2). The Tool can be run with any combination or all analyses provided that data are included in each of the analysis tables. Also, there are six GI feature types in the Tool: bioretention, permeable pavement, vegetated swale, stormwater wetlands, wet pond, and infiltration trench. Any combination or all feature types can be selected when running the Tool.
The Regional Base Analysis is hardcoded and can’t be modified in the Tool. However, including the Regional Base Analysis in the Tool run is optional. This analysis provides a first estimate of GI possible locations based on regional data sets including depth to groundwater, hydrologic soil type, land use, liquefaction risk, and slope. In the analysis, each regional data set is weighted to reflect relative importance for GI suitability and is binned into relevant value bins which are ranked according to suitability for each GI type. These weights and rank values are then used in a Categorical Weighted Overlay to produce maps of the most suitable areas for each GI type. Since the data are regional in nature, the map outputs are grosser in scale and may remove potential GI locations from the output. Users can experiment by running the Tool with and without the Regional Base Analysis and then compare map outputs or use the RBA in the Opportunities and Constraints Analysis in a later step.
The Locations Analysis uses regional and local data layers to identify locations for GI implementation for each GI feature type selected. Specified location layers that are identified as potential locations are unioned in order to create a single layer for each GI type that represents all potential locations for that GI type. On-street parking, sidewalks, pedestrian trails, parking lots, and parks are example locations for implementing GI. Other potentially good locations could include traffic medians, brown field lots, and undeveloped land.
The Opportunities and Constraints Analysis is an editable table where both regional and local data sets can be added. Each data set is ranked as an opportunity (rank of 1) or a constraint (rank of -1) for GI implementation. Each data layer is then categorized into factors and then individually weighted within its factor. A weight is then assigned to each factor. These values were then used to calculate a final relative rank for each location.
The Ownership Analysis allows the Tool to delineate outputs into public and private possible location. This is only possible if a local ownership data layer exists. The ownership analysis can be important for identification of potential public private partnerships. It can also provide an opportunity to grossly analyze the proportional opportunity between publicly and privately own lands.
The Knockout Analysis in the Tool excludes landscape features that should not be included for GI consideration such as wetlands, riparian areas, and tidal areas. Buffer areas can be added to these features as well.
Once GI feature types have been selected and all input tables are filled out and the analyses are selected the Tool runs through each analysis sequentially. The Regional Base Analysis takes the area of interest and excludes all regional areas that were determined not suitable for each GI type. Next, the Locations Analysis intersects the Base Analysis area with all possible GI locations that were specified for each GI type selected. This refines the output to include only locations that are possible, as determined by the Regional Base Analysis, and meet the requirements identified in the Locations Analysis. The Opportunities and Constraints Analysis then applies a relative rank for each location by preforming a nested weighted sum. The Ownership Analysis then applies specified ownership data in order to label each location as either public or private. Lastly the Knockout Analysis removes any areas that are deemed infeasible from the map output.
The Tool produces a KML (Google Earth) and Arc-GIS map with color-coded relative rank of potential GI locations. The developed maps should then be validated via an on screen or field effort to provide verification of the ability for the input data and data ranking to produce real world results. Once validated, these sites, combined with local expert unmapped information such as areas of flooding or high pollutant areas, can serve as a starting point to plan and prioritize placement of GI within a watershed. The identified sites can also be used by the Optimization Tool to construct and constrain all potential locations in order to identify most cost-effective combinations for achieving specific management targets.
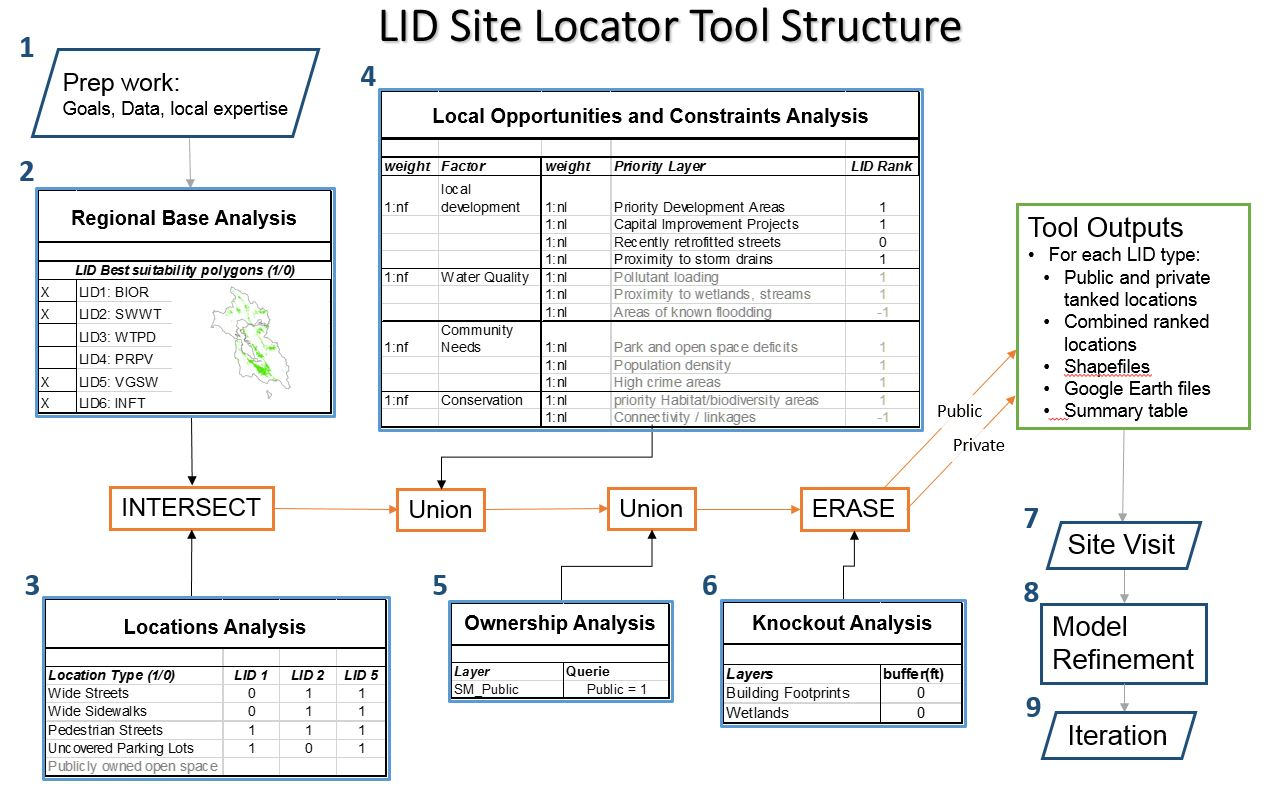
Figure 1-2. Structure of the GIS Site Locator Tool including pre-tool preparation and post tool steps.
Modeling Tool
The second tool component of the GreenPlan-IT Toolkit is built on a spatially distributed hydrologic and water quality model, EPA Storm Water Management Model (SWMM) version 5.0 (Rossman, 2010), to simulate the generation, fate and transport of stormwater runoff and associated pollutants from the landscape, as well as resulting flow and pollutant loading reduction as they pass through various GIs. The Modeling Tool is used to establish baseline conditions, identify high-yield runoff and pollution areas; and quantify any reduction made from GI implementation across different areas within a watershed. Within the Toolkit, the Modeling Tool serves as a subroutine to the Optimization Tool. At each iteration during the optimization process, the Optimization Tool will commend the Modeling tool to evaluate GI performance and pass that information back. This process progresses step by step marching towards the most cost-effective GI solutions.
Optimization tool
The third tool is an Optimization Tool which uses an evolutionary optimization technique (Non-dominated Sorting Genetic Algorithm II , Deb, et al 2002) to evaluate the benefits (runoff and pollutant load reductions) and costs associated with various GI implementation scenarios (type, location, number) and identify the most cost-effective options that satisfy user-defined management goals. The Optimization Tool requires the site information generated from the GIS Site Locator tool to form its search space, and uses the Modeling Tool as a subroutine during the search process in an iterative and evolutionary fashion to evaluate the GI performance. Therefore, using the Optimization Tool will require the running of both the Site Locator Tool and Modeling Tool.
1.3 GreenPlan-IT Toolkit Application Process
The application of the GreenPlan-IT Toolkit usually begins with the GIS Site Locator Tool, followed by the Modeling Tool, and concludes with the Optimization Tool. Since the Toolkit is constructed in a modular structure with three standalone tools, users can sometime choose to use just the GIS Site Locator Tool to do a preliminary screening on potential GI sites instead of using the full package. However, within the premise of this project, wherever possible, the application of the whole Toolkit is recommended, since optimal placement (achieving the most flow or load reduction) for the least cost is usually in the best interests of the public.
The typical step-by-step process in Toolkit application is as follows: 1) definition of study objectives; 2) data collection; 3) Toolkit setup, and 4) analysis of results. Figure1-3 is a flow diagram illustrating the Toolkit application process. The first step in the setup and application of the Toolkit is a clear definition of the study goals to ensure the most appropriate and useful application. An example of a study objective might be to identify a set of management options that achieve a required level of runoff. The study goals will define the scope and extent of the Toolkit application, including model domain, data needs, runoff and pollutant factors to be simulated, and the optimization evaluation factors and flow or pollutant load reduction targets.
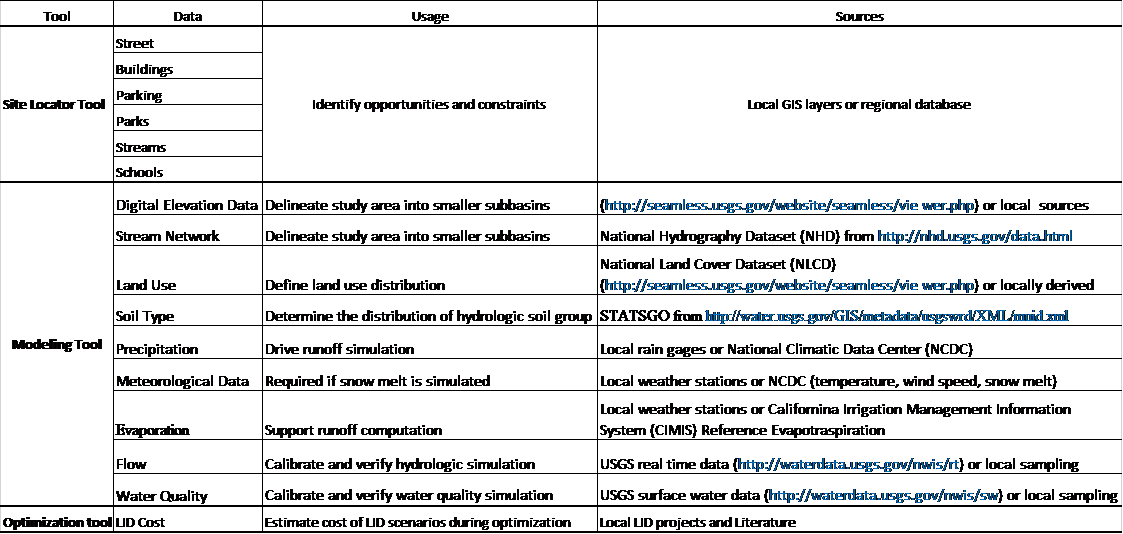
The data collection for the Toolkit application involves a thorough review and compilation of data available for the study area. The Toolkit requires a variety of input data including GIS data, landscape characteristics data, GI data, and monitoring data. Table 1-1 shows a summary of typical data needs for each tool. Because the quality of the Toolkit outputs depends on the quality of input data, locally derived higher-resolution data are desired, wherever possible.
Setting up the Toolkit involves using the data collected to establish a representation of the study area. Since there is no linkage between the Site Locator Tool and Modeling Tool, they can be set up in parallel. In the case of the Modeling Tool, model calibration with local data is needed in order to ensure the establishment of a representative baseline condition. The Optimization Tool then synthesizes information from the Site Locator Tool and Modeling Tool and generates solutions that are looped back to the Modeling Tool for an iterative evaluation. Via this evolutionary search process, the most cost-effective GI solutions are identified according to the user’s specific conditions and objectives. The results of the application include the cost/benefit associated with a range of flow or loads reduction targets, ranking of sites for specific optimal solutions, and maps showing the distribution of GI within the study area under a specific optimal solution.
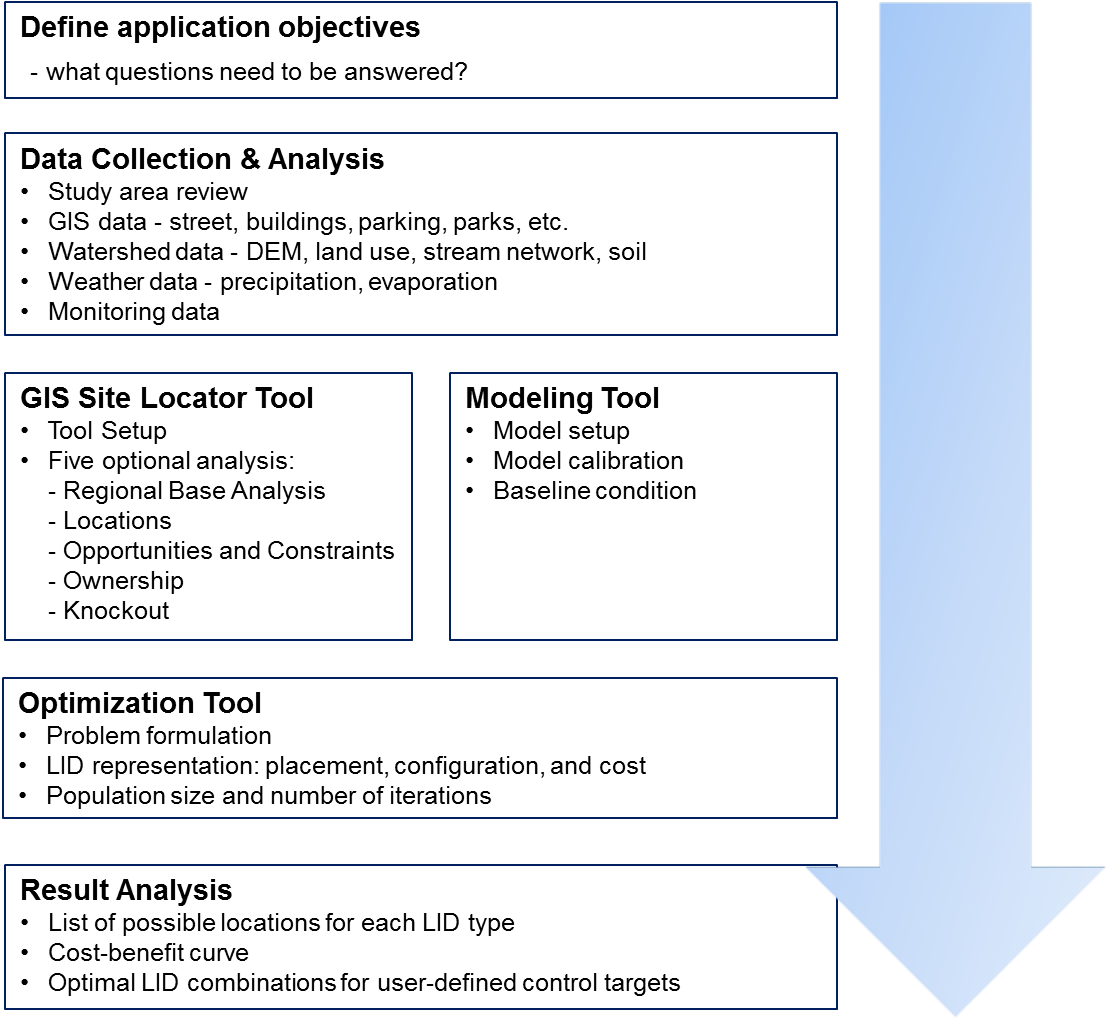
Figure 1-3. GreenPlan-IT Toolkit application process.
Table 1-1 Summary of typical data needs for the Toolkit
[1] Initiated by San Francisco Estuary Partnership (SFEP), San Francisco Estuary Institute (SFEI), Bay Area Storm Water Management Agencies Association (BASMAA), and partnering municipalities in 2013 through the Proposition 84 Storm Water Grant Program.