
Technical Memo
06.14.2018
Prepared by Tony Hale, PhD
San Francisco Estuary Institute
4911 Central Ave.
Richmond, CA 94804
Table of Contents
About the GreenPlan-IT Toolkit
The Purpose of the GreenPlan-IT Tracker
Intended Audience for this Document
Figure 1 : The Richmond Waterfront and associated green infrastructure.
Detailed Information on a per-site basis
Figure 2: Detailed Information on facilities.
Figure 3: Detailed geospatial designation of drainage management areas and treatment areas.
Reporting information for inclusion in stormwater reports
Figure 4: Information suitable for inclusion in stormwater reports.
“Effectiveness reporting” for individual installations
Figure 5: Effectiveness Reporting by individual facility.
“Effectiveness reporting” for the municipal green infrastructure portfolio
Figure 6: Effectiveness Reporting by jurisdiction.
Mapping of sites for external use
Figure 7: Embeddable map of the City of Richmond.
Figure 8: List of sites with link to export data.
Mobile-enabled entry and editing
Figure 9: Mobile view of Maintenance and Inspection Logs
Figure 10: Servers in a data center
Project: Healthy Watersheds, Resilient Baylands
Figure 11: Conceptual ERD for GreenPlan-IT Tracker.
Effectiveness Reporting Submodule
Summary of effectiveness reporting processing
Effectiveness Reporting Submodule
List of Figures
Overview
This technical memo describes the purpose, functions, and structure associated with the newest addition to the GreenPlan-IT Toolset, the GreenPlan-IT Tracker. It also shares the opportunities for further enhancement and how the tool can operate in concert with existing resources. Furthermore, this memo describes a licensing plan that would permit municipalities to use the tool in an ongoing way that scales to their needs. The memo concludes with a provisional roadmap for the development of future features and technical details describing the tool’s platform and data structures.
About the GreenPlan-IT Toolkit
Municipalities across the state and beyond are carefully planning and implementing green infrastructure in their developed landscape to restore key aspects of the natural water cycle. Green infrastructure helps to achieve stormwater attenuation and contaminant filtration by increasing the pervious surfaces in often sophisticated ways. Additionally, green infrastructure features, as city dwellers have come to realize, demonstrate multiple benefits in addition to improving surface porosity, such as peak, volume, and load reductions, urban heat island mitigation, traffic calming, carbon sequestration, wildlife habitat, natural aesthetics, and others. The benefits are substantial, but so are the potential costs. GreenPlan-IT helps planners to make smart decisions in the types and locations of green infrastructure, minimizing effort and cost while maximizing the effectiveness of the public and private investments.
GreenPlan-IT modules are focused on green infrastructure planning and assessment, including the Site Locator Tool, Modeler, and Optimizer tools. Together the modular toolkit can be used to take a city from a position of not knowing where to consider GI placement (a daunting position given the MRP C3 and C11/12 requirements), to a plan that includes a list and map of feasible locations and a map of baseline flow and pollutant load conditions, and a selected optimal set of placement locations for achieving flow and load reductions at minimal cost. Now, with the advent of the GreenPlan-IT Tracker, there is also a web based tracker for quantifying and communicating the locations, types, and treatment areas of GI installations (the outputs of all the planning efforts) and quantifying the peak flows, volumes, and loads reduced (the outcomes of all the implementation and cost expenditure that the community is asking for).
The Purpose of the GreenPlan-IT Tracker
GreenPlan-IT Tracker complements the other components of the GreenPlan-IT toolset, a modular resource for municipalities seeking to plan for, optimize, and track their Green Infrastructure (GI). Unlike the other modules, however, the new GreenPlan-IT Tracker attends to the already-installed features, rather than prospective and planning-level work associated with Green Infrastructure. Accordingly, the Tracker tool handles the accounting of GI across the landscape, recording the characteristics of those installations, the geospatial details, and calculating the effect of those features on stormwater flow attenuation and filtration.
Value Proposition
Why would people use GreenPlan-IT Tracker? The tool is designed to track locations, treated pollutant mass, maintenance needs, and report spatial and cumulative outcomes of GI implementation for annual reports over years and decades. Rather than recording this information in a general purpose geodatabase -- as is the current convention among most Bay Area cities -- this tool saves its users time while also offering deeper insight into the locations, specifications, and effectiveness of their ever-growing portfolio of green infrastructure. Because it was developed using a highly versatile and flexible interface, the tool can be tailored to meet the needs of individual cities while also leveraging features common to all. It is easy to use and provides ready export capability so that users can readily take their data to go whenever they’d like.
Intended Audience for this Document
This document addresses topics designed for municipal staff, stormwater program leads, NGO representatives responsible for stewarding green infrastructure, and technical experts who are interested in learning about the suitability of the tool and applying it to meet their needs.
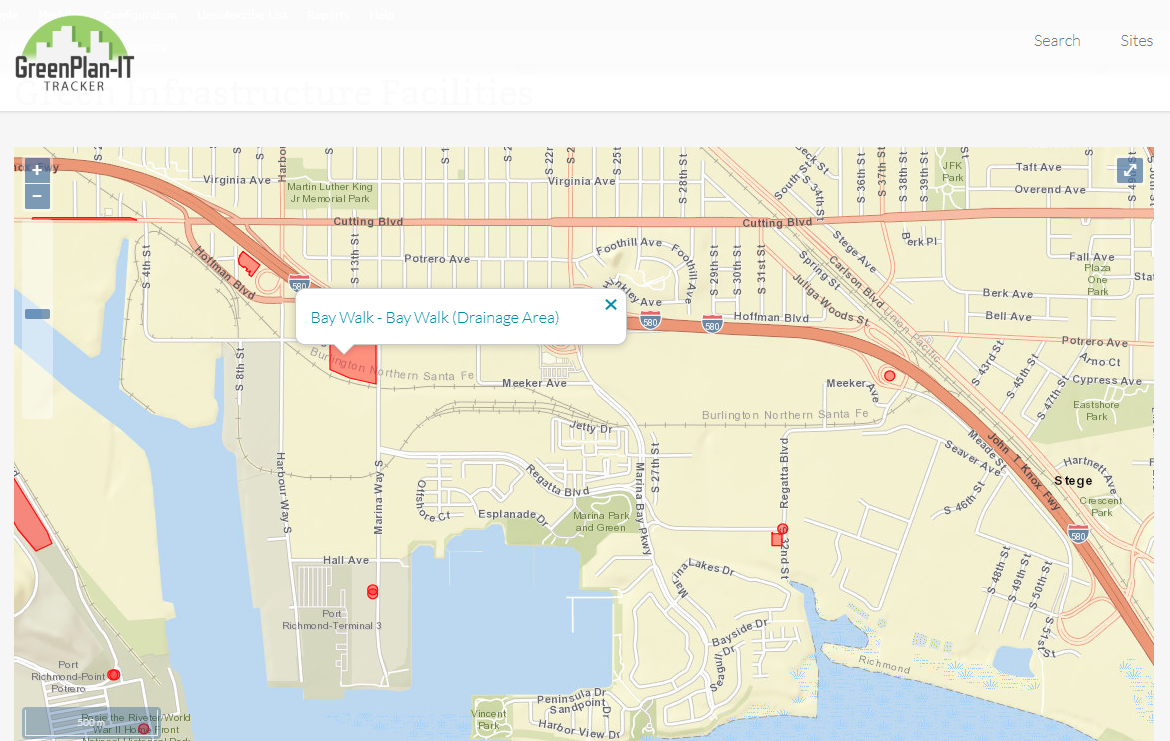
Figure 1 : The Richmond Waterfront and associated green infrastructure.
The GreenPlan-IT Tracker places green infrastructure facilities into their proper context. Figure 1 shows the Richmond waterfront with red areas marking drainage management areas associated with installed green infrastructure. Clicking on a polygon provides easy access to more information with another click.
Key Functions and Features
Detailed Information on a per-site basis

Figure 2: Detailed Information on facilities.
The tool records and displays critical information about the outputs of city planning and GI implementation for each installed facility. This includes specifics regarding the type, configuration, and geospatial information. It also records maintenance and monitoring logs that can be accessed from field locations: a key feature to help ensure that the installed facilities and the associated municipal expenditures continue to provide the value back to the community as designed.
Geospatial capabilities
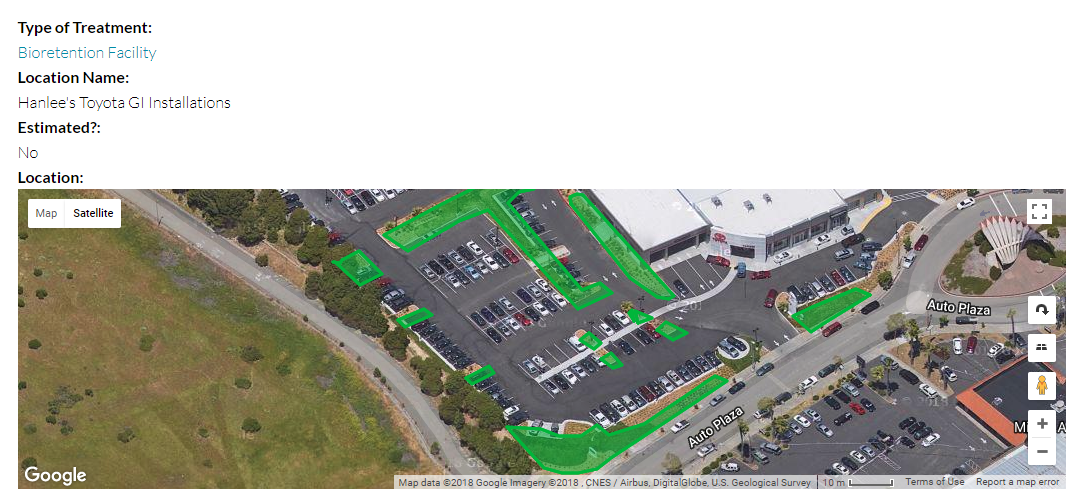
Figure 3: Detailed geospatial designation of drainage management areas and treatment areas.
The Tracker offers the ability to generate polygons in the browser, associated with drainage management areas and treatment areas. These designated areas help to determine the effect of the GI facility when also combined with its type of treatment, the configuration of its associated features, and the location in the subwatershed.
Reporting information for inclusion in stormwater reports
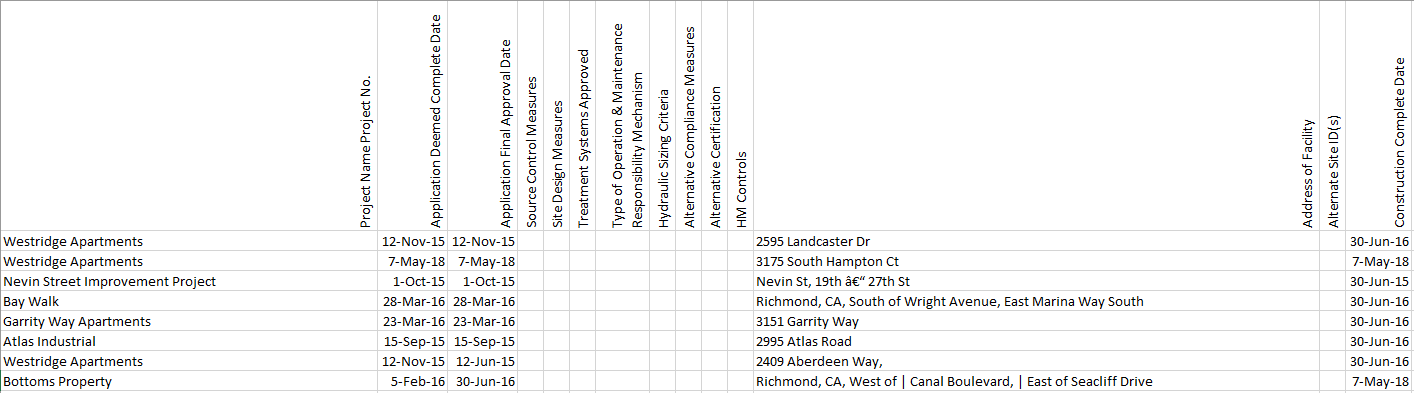
Figure 4: Information suitable for inclusion in stormwater reports.
The information stored in GreenPlan-IT reflects the information reported for individual green infrastructure facilities reported under the Provision C.3 of the Municipal Regional Permit, requiring the reporting of new development and redevelopment for regulated and special projects.
“Effectiveness reporting” for individual installations

Figure 5: Effectiveness Reporting by individual facility.
The system calculates effectiveness for individual installations. The system also calculates effectiveness on the basis of the type of green infrastructure, its specific design configuration, and its location. These factors are used to generate the effectiveness view on a per-site basis, as processed by EPA’s SWMM model in the modeler tool component, and then displayed on individual sites
Figure 5 above illustrates some sample effectiveness output. “Baseline,” in this figure, represents the estimated metrics without any GI. The columns showing “With LID” account for the effect of the individual facility. The calculated information displayed is influenced by the type of facility / BMP /LID, the details of its configuration (usually established for each green infrastructure type county-wide), and its specific location within the watershed. The SWMM model processes these inputs to determine how much infiltration of stormwater is increased and how much PCB would be removed with and without the given facility. Further information on any of the displayed items is available by hovering over the items.
“Effectiveness reporting” for the municipal green infrastructure portfolio

Figure 6: Effectiveness Reporting by jurisdiction.
Similar to the modeling based on individual facilities, the system also calculates effectiveness for the entire municipal jurisdiction on the basis of the city’s green infrastructure portfolio. The individual types of green infrastructure, their specific configurations, and their locations are collectively taken together and then processed by EPA’s SWMM model in the modeler tool of the toolkit, which employs an algorithm to calculate the collective effectiveness, which are the outcomes identified by the community in attenuating stormwater flow and filtering pollutants.
This jurisdictional view in figure 6 offers a very unique sense of the growing portfolio. The years mark the completion dates for construction of the individual green infrastructure facilities. This effectiveness reporting fosters understanding of the value of the city’s managed portfolio through a line chart that measures the increasing number of acres treated as the impervious landscape becomes more porous. Viewers, including community members and resource planners, can measure the contribution to the city’s overall attenuation of stormwater flow and pollutant load reduction in alignment with the city’s goals and permit requirements.
Mapping of sites for external use
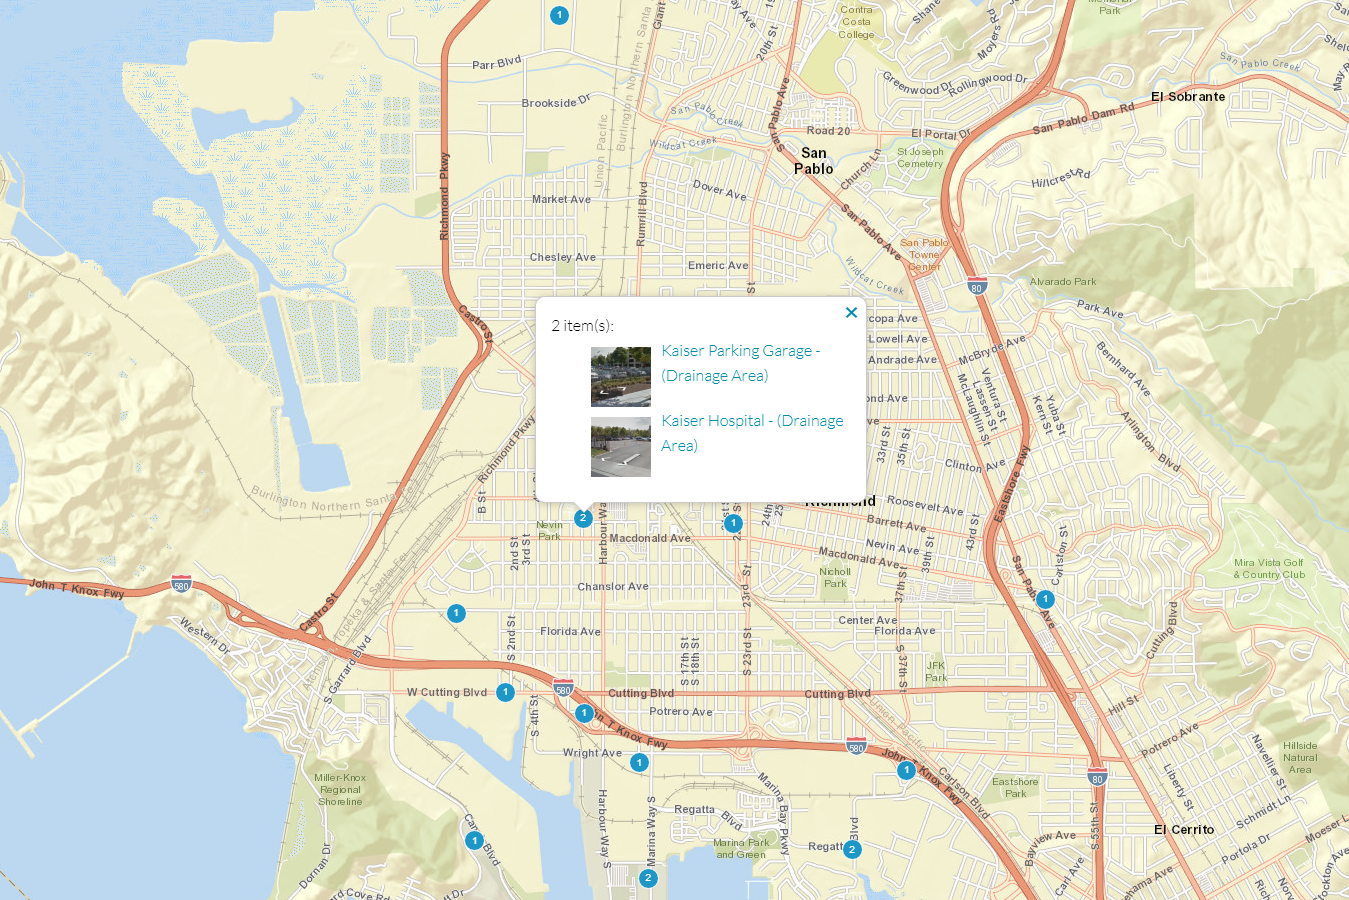
Figure 7: Embeddable map of the City of Richmond.
Sites entered into the system can be displayed by the municipality on dynamic Tracker maps that can, in turn, be embedded into the municipal website pages, staff reports, quarterly reports to the council, or any other regular reporting requirements to show the value, the outcomes of the city’s investment in green infrastructure.
Importing and exporting
Figure 8: List of sites with link to export data.
Importing new records about additions and changes to new or upgraded facilities is accomplished by entering data into the available forms. Or data can be provided to the tool’s stewards, SFEI, for reformatting and integration.
Exporting data is available for a given jurisdiction. After narrowing a list of sites to those in a selected jurisdiction, you may download the associated data, or transfer it to other platforms or data management systems as illustrated in figure 8. (You must have permission to view the data to be displayed.)
Mobile-enabled entry and editing
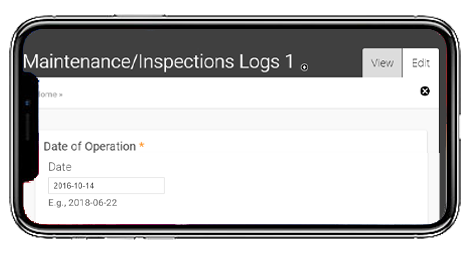
Figure 9: Mobile view of Maintenance and Inspection Logs
Responsive design allows technicians in the field to view, enter, and update information on their tablets or phones.
Licensing Plan

The Tracker is slightly different from the other modules in the GreenPlan-IT toolset. The Site Locator Tool, Modeler, and Optimizer are sophisticated, downloadable tools designed to help municipalities plan and assess their green infrastructure investments. They are freely available on the GreenPlan-IT website: http://greenplanit.sfei.org. Unlike other modules within the GreenPlan-IT toolset, the Tracker is not able to be distributed since it follows a software-as-a-service model. Its value lies in its accessibility as an easy-to-use, always-available centralized website and database.
The licensing fees will cover costs for hardware (server and networking equipment), bandwidth, software upgrades, basic application enhancements, and customer support.
The tiers for ongoing support are as follows:
- 1-100 Sites: $1,000 / year
- 101-500 Sites: $2,000 / year
- 501-2000 Sites: $3,000 / year
- 2001 - 5000 Sites: $4,500 / year
- > 5000: $6,000 / year
In this way, a relatively meager investment is leveraged at great value to the users and the communities they serve. The team will work with municipal managers to re-assess the licensing fees on an annual basis to ensure that a fair value is delivered.
Roadmap
This licensing structure supports the Tracker tool’s upgrades as necessary and the team’s availability to attend to user needs beyond the term of the EPA-funded contract. While we can forecast which needs might arise, we cannot always predict with great accuracy which should receive immediate attention. However, based on feedback received and opportunities already identified, what follows is a forecast of further development for the GreenPlan-IT Tracker.
Client-Base Expansion
With interest in GreenPlan-IT remaining high, the SFEI team plans for continued growth of the Tracker tool, along with the Site Locator, Modeler, and Optimizer.
Cities will continue to use Tracker to record additional sites and leverage the output for reporting. The team will support additional cities who wish to avail themselves of these features. Cities might also test their assumptions about the effectiveness of their managed portfolio of green infrastructure against the SWMM-based modeling output available to them. As implementation expands beyond the cities already using the tool, we can anticipate changes to the tool. It is designed to be extensible to customization as needs are expressed by the user base. Those changes might include some of the following ideas:
Customized Charting
The charts available to users of the tool are solid but limited. We anticipate that cities may wish to develop their own items to be charted based on as-yet-to-be determined factors.
Regional Analysis
With additional cities contributing to the Tracker, analyses conducted beyond the individual counties will be possible. The calculations for effectiveness at a more regional scale can be added to aid local decision makers who may wish to coordinate efforts at a broader scale.
Additional Modeling
The SWMM-based modeling integrated into the Tracker is a useful addition. It exposes a handful of calculations deemed to be useful to stewards of the green infrastructure. However, there are additional materials that can be calculated, shared, and visualized within the tool.
Project: Healthy Watersheds, Resilient Baylands
Another project funded by EPA’s Water Quality Improvement Fund, “Healthy Watersheds, Resilient Baylands,” will address opportunities near the Bay’s edge to address water quality needs through the use of ecologically focused solutions. GreenPlan-IT will be enhanced within this project to deliver ecologically informed hydrologic assessments of the urban landscape. At the same time, there are other project proposals in the works that may yield new enhancements for the Toolset.
Technical Specifications
The system includes primary data sources, imported or manually inputted into the system. In figure 11 below, this information falls under “Direct Inputs.” This directly contributed information is available for output via exports. The system also features information calculated or derived from the primary data, using them as inputs to a model, designed to determine the overall effectiveness, the outcomes of the green infrastructure portfolio in relation to the City's goals and permit requirements. This information is termed “Derived Outputs” in the figure below because it is the result of processing the accumulated raw data that the tool stores and turning it into the needed information for reporting out on monthly, quarterly or annual time intervals to city departments, community groups, regulators and the city council.
Figure 11: Conceptual ERD for GreenPlan-IT Tracker.
The ERD is conceptual in the context of the database because the content management system is non-normalized. It does not adhere to the conventional standards of a database designed specifically for this purpose. This allows the database versatility and adaptability. The section dedicated to effectiveness reporting does describe a more conventional normalized database model. In either case, we do document the fields nevertheless in the following collection of resources.
Platform
The Tracker is designed using open-source tools to minimize software and maintenance costs, while affording the greatest possible transparency. Documented below are the specifications for the operating system, application, scripts, database, and data structures.
Primary Application
- Operating system: Ubuntu
- Database: Postgres
- Content management system: Drupal
- Geospatial engine: PostGIS
- Geospatial visualization: OpenLayers
The primary application permits role-based security by virtue of the Drupal content management system (CMS). PostGIS and Openlayers, working together, offer geospatial enhancements to the CMS that offer advanced in-browser feature editing. The native reporting features offer sustainable and customizable reporting outputs.
Effectiveness Reporting Submodule
- Operating system: Ubuntu
- Database: Postgres
- Scripting Language: Python
- Modeling engine: SWMM5
Summary of effectiveness reporting processing
One novel innovation of the GreenPlan-IT Tracker is the integration of EPA’s SWMM5 model into the Tracker online database. The scripts are written in Python using a wrapper to call the EPA's SWMM5 model (https://pypi.org/project/SWMM5/). An unmodified version of SWMM5 handles all of the analysis. Meanwhile, the Python-based wrapper code manages the tasks, dynamically modifying a template SWMM input file, triggering SWMM via the wrapper library, parsing the output file, and updating the analytical database.
Detailed description
The processing proceeds in this fashion on a daily basis:
- Tasks are stored in the GPT database when any node is modified by Drupal (using short Drupal module written in PHP)
- Python, when run, retrieves the list of queued tasks from the database
- Duplicate tasks or tasks with insufficient input data are marked as such and ignored
- For each valid task, Python queries the database to get relevant input data, then modifies a "template" SWMM5 input file (just formatted text really). The template being manually created for each region/jurisdiction.
- The wrapper triggers SWMM5 to run using that modified input file and Python waits for it to finish.
- Once finished, Python parses the output report file (just formatted text), then uploads the relevant data back into the GPT database.
- The regional tasks are run similarly, except instead of just using one node to modify the input, it uses all the nodes within the jurisdiction.
Field specs
Primary Application
Watershed Characteristics
- TABLE: Watershed Identification
- Watershed_ID
- Char
- 24
- Watershed_Name
- Char
- 256
- Watershed_ID
Socio - Economic Characteristics
- TABLE: Site_Location
- City
- Char
- 60
- County_Code
- Char
- 5
- State_Code
- Char
- 2
- Zip
- Char
- 14
- Geocode_Latitude
- Char
- 10
- Geocode_Longitude
- Char
- 11
- Reference_Datum (Horizontal)
- Char
- (e.g., NAD83, WGS84)
- City
LID Characteristics
- TABLE: Identification
- Title
- Char
- 256
- Alternate_Site ID(s)
- Char
- 24
- Alternative_Certification
- Char
- 24
- Alternative_Compliance_Measures
- Char
- 24
- Description
- Char
- Long
- Name_of_Developer
- Char (Validated)
- 24
- Public/Private
- Char (Validated)
- 24
- Status
- Char (Validated)
- 24
- Total_Area_of_Land_Disturbed (Acres)
- Num
- Total_New_Impervious_Surface_Area (ft2)
- Num
- Total_PostProject_Impervious_Surface_Area (ft2)
- Num
- Total_PreProject_Impervious_Surface_Area (ft2)
- Num
- Total_Replaced_Impervious_Surface_Area (ft2)
- Num
- Total_Site_Area (Acres)
- Num
- Title
- TABLE: GI_feature_area
- Associated_LID_ID
- Char
- 24
- Geometry
- Char
- Long
- Location
- Binary
- KML
- Latitude
- Double
- Feature Centroid
- Longitude
- Double
- Feature Centroid
- Area
- Num
- Reference_Datum (Horizontal)
- Associated_LID_ID
- TABLE: Owner_Information
- Owner_type
- Char
- 24
- Owner_Name
- Char
- 50
- Owner_Contact
- Char
- 50
- Owner_type
- TABLE: Drainage_management_area
- Type_of_Treatment_HM_Controls_Inspected
- Char
- 24
- Location_Name
- Char
- 256
- Estimated
- Char
- 24
- Geometry
- Char
- Long
- Location
- Binary
- KML
- Latitude
- Double
- Longitude
- Double
- Reference_Datum (Horizontal)
- Type_of_Treatment_HM_Controls_Inspected
Design Characteristics
- TABLE: Infiltration_rates
- Capacity
- Num
- filter_rate
- Num
- Designed_to_Hold_Water_72_Hours
- Char
- 24
- Capacity
- TABLE: Soil_media
- Type
- Char
- 24
- Depth
- Num
- Num
- Type
- TABLE: Permitting_process
- Application_Deemed_Complete_Date
- Date
- Application_Final_Approval_Date
- Date
- Construction_Complete_Date
- Date
- Application_Deemed_Complete_Date
Costs
- TABLE: LID_costs
- Installation_cost
- Num
- Mainanence_cost
- Num
- Rehabilitation_cost
- Num
- Installation_cost
Maintenance Information
- TABLE: Event_Maintenance
- LID_ID
- Char
- 24
- Date
- Date
- Type_of_Operation_Inspection
- Char
- 24
- Inspection_Findings_or_Results
- Char
- Long
- Enforcement_Action_Taken
- Char
- Long
- Comments_Follow-up
- Char
- Long
- Activity
- Char
- Long
- Outcome
- Char
- Long
- Status
- Char
- 24
- LID_ID
Reports / Engineered Drawings
- TABLE: File_Attachments
- File_Attachment
- Binary
- Comments
- Char
- Long
- Date
- Date
- File_Attachment
Lookup Tables
TABLE: LID_Types
|
Code |
Description |
|
biornu |
Bioretention without an Underdrain |
|
biorwu |
Bioretention with an Underdrain |
|
ftpb |
Flow Through Planter Box |
|
inft |
Infiltration Trench |
|
prpv |
Permeable Pavement |
|
swwt |
Stormwater Wetland |
|
trbx |
Tree Box |
|
vgsw |
Vegetated Swale |
|
wtpd |
Wet Pond |
TABLE: Maintenance_Status
|
Code |
Description |
|
NM |
needs maintenance |
|
GC |
good condition |
|
SM |
scheduled for maintenance |
TABLE: Owner_type
|
Code |
Description |
|
CNG |
County Government |
|
COR |
Corporation |
|
CTG |
Municipality |
|
DIS |
District |
|
FDF |
Federal Facility (U.S. Government) |
|
GOC |
GOCO (Gov Owned/Contractor Operated) |
|
IND |
Individual |
|
MWD |
Municipal or Water District |
|
MXO |
Mixed Ownership (e.g., Public/Private) |
|
NON |
Non-Government |
|
POF |
Privately Owned Facility |
|
SDT |
School District |
|
STF |
State Government |
|
TRB |
Tribal Government |
|
UNK |
Unknown |
Effectiveness Reporting Submodule
The effectiveness reporting subsystem leverages EPA’s SWMM5 model to calculate a number of key outputs from the data within the system. The tables below are discrete from the functions associated with the general tracker application since these tables are specialized to hold SWMM-based parameters, input data, and output data.
Task tables
- TABLE: task
Table of all SWMM tasks. Populated by drupal on node update hook. Updated and run (or declined) by Python/SWMM scripts.
- taskid
- Integer
- Unique, non-null, primary key
- Autofill, sequential
- nodeid
- Integer
- Statuscode
- Text
- Matches key “statuscode” in table “statuslu”
- Only used when linked to regional tasks to track total treated drainage management area in regional run
- requestdate
- Timestamp
- processdate
- Timestamp
- finishdate
- Timestamp
- modelversion
- Text
- totaldma
- Integer
- TABLE: regionaltask
A table for tracking regional tasks, that is, a task aggregating a whole region (as opposed to individual GI installation). Does not track the model task itself, but each entry is linked to a task in the task table.
- regiontaskid
- Integer
- Unique, non-null, primary key
- Autofill, sequential
- regionid
- Integer
- Matches key “regionid” in table “regionlu”
- taskid
- Integer
- Matches key “taskid” in table “task”
- statuscode
- Text
- Matches key “statuscode” in table “statuslu”
- taskyear
- Integer
- tasktype
- Text
- To identify task if not by year (usually ‘baseline’ task or ‘all’ task)
- lasttaskid
- Integer
- Matches key “taskid” in table “task”
- Last completed task id if new task in queued or processing
Output Tables
- TABLE: runoffoverview
Summary of runoff quantity continuity. Will only be one row per task.
- runoffoverviewid
- Integer
- Unique, non-null, primary key
- Autofill, sequential
- taskid
- Integer
- Matches “taskid” in table “tasks”
- initiallidstorage
- Float
- Acre-feet
- evaporationloss
- Float
- Acre-feet
- infiltrationloss
- Float
- Acre-feet
- surfacerunoff
- Float
- Acre-feet
- finalstorage
- Float
- Acre-feet
- continuityerror
- Float
- totalprecipitation
- Float
- Acre-feet
- TABLE: pollutantoverview
Summary of runoff quantity continuity for pollutants. One row per task per pollutant tracked (which for now is only PCB).
- pollutantoverviewid
- Integer
- Unique, non-null, primary key
- Autofill, sequential
- taskid
- Integer
- Matches “taskid” in table “tasks”
- pollutant
- Text
- We only track PCB so value here will only be that, but leaving flexible in case that changes in the future
- initialbuildup
- Float
- Values in lbs (at least for PCB, only output we track for now)
- surfacebuildup
- Float
- Values in lbs (at least for PCB, only output we track for now)
- wetdeposition
- Float
- Values in lbs (at least for PCB, only output we track for now)
- sweepingremoval
- Float
- Values in lbs (at least for PCB, only output we track for now)
- Infiltrationloss
- Float
- Values in lbs (at least for PCB, only output we track for now)
- bmpremoval
- Float
- Values in lbs (at least for PCB, only output we track for now)
- surfacerunoff
- Float
- Values in lbs (at least for PCB, only output we track for now)
- remainingbuildup
- Float
- Values in lbs (at least for PCB, only output we track for now)
- continuityerror
- Float
- TABLE: runoff
Detailed runoff statistics. This and following tables designed to handle multiple rows per task, for each LID, for each subcatchment, or combination thereof as necessary.
- runoffid
- Integer
- Unique, non-null, primary key
- Autofill, sequential
- taskid
- Integer
- Matches “taskid” in table “tasks”
- subcatchmentid
- Integer
- Matches “id” in table “subcatchments”
- I don’t think region_id is needed since subcatchment_id should be unique itself
- totalprecipin
- Float
- Inches
- totalevapin
- Float
- Inches
- totalinfilin
- Float
- Inches
- totalrunoffin
- Float
- Inches
- totalrunoffgal
- Float
- Gallons (technically SWMM outputs in mega-gallons, note to self, either convert before storing value or be sure to note it’s not in straight gallons)
- peakrunoffcfs
- Float
- CFS
- runoffcoeff
- Float
- TABLE: lidperformance
Detailed LID statistics.
- lidperformanceid
- Integer
- Unique, non-null, primary key
- Autofill, sequential
- taskid
- Integer
- Matches “taskid” in table “tasks”
- subcatchmentid
- Integer
- Matches “subcatchmentid” in table “subcatchments”
- lidtype
- Text
- totalinflowin
- Float
- Inches
- evaplossin
- Float
- Inches
- infillossin
- Float
- Inches
- surfaceoutflowin
- Float
- Inches
- drainoutflowin
- Float
- Inches
- initialstoragein
- Float
- Inches
- finalstoragein
- Float
- Inches
- continuityerror
- Float
- TABLE: washoff
Detailed washoff statistics.
- washoffid (need better name)
- Integer
- Unique, non-null, primary key
- Autofill, sequential
- taskid
- Integer
- Matches “taskid” in table “tasks”
- subcatchmentid
- Integer
- Matches “subcatchmentid” in table “subcatchments”
- pcblbs
- Float
- PCB in lbs
- May potentially be more columns for other pollutant types, but would follow same format (for now PCBs are only ones we track)
Lookup tables (and also subcatchment)
- TABLE: statuslu
Status types (e.g. “Processing”, “Declined”, “Error”).
- statuscode
- Text
- Unique, non-null, primary key
- statusname
- Text
- statusdesc
- Text
- TABLE: regionlu
Regions for different jurisdictions and/or SWMM model input. Right now should only hold “Richmond”.
- regionid
- Integer
- Unique, non-null, primary key
- regionname
- Text
- regiontid
- Integer
- TID for jurisdiction as tracked in Drupal
- TABLE: subcatchment
Watershed subcatchment geometries.
- subcatchmentid
- Integer
- Unique, non-null, primary key
- subcatchmentname
- Text
- regionid
- Integer
- Matches key “regionid” in table “regionlu”
- geom
- Geometry (EPSG 3310)
